Submit an Article
Navigate
Home
Editorial Board
Editorial Policies
Current Volume
Archive
Scientific Integrity
Publication Ethics Statements
Interviews with Outstanding Authors
Newsroom
Sponsored Conferences
Podcast
Contact
Special Collections
Submit an Article
Online ISSN: 1945-4589
Research Paper
|
Volume 13, Issue 16
|
pp. 20836–20852
Heparanase is a novel biomarker for immune infiltration and prognosis in breast cancer
Back to article
Figure 5
(5 of 5)
−
100%
+
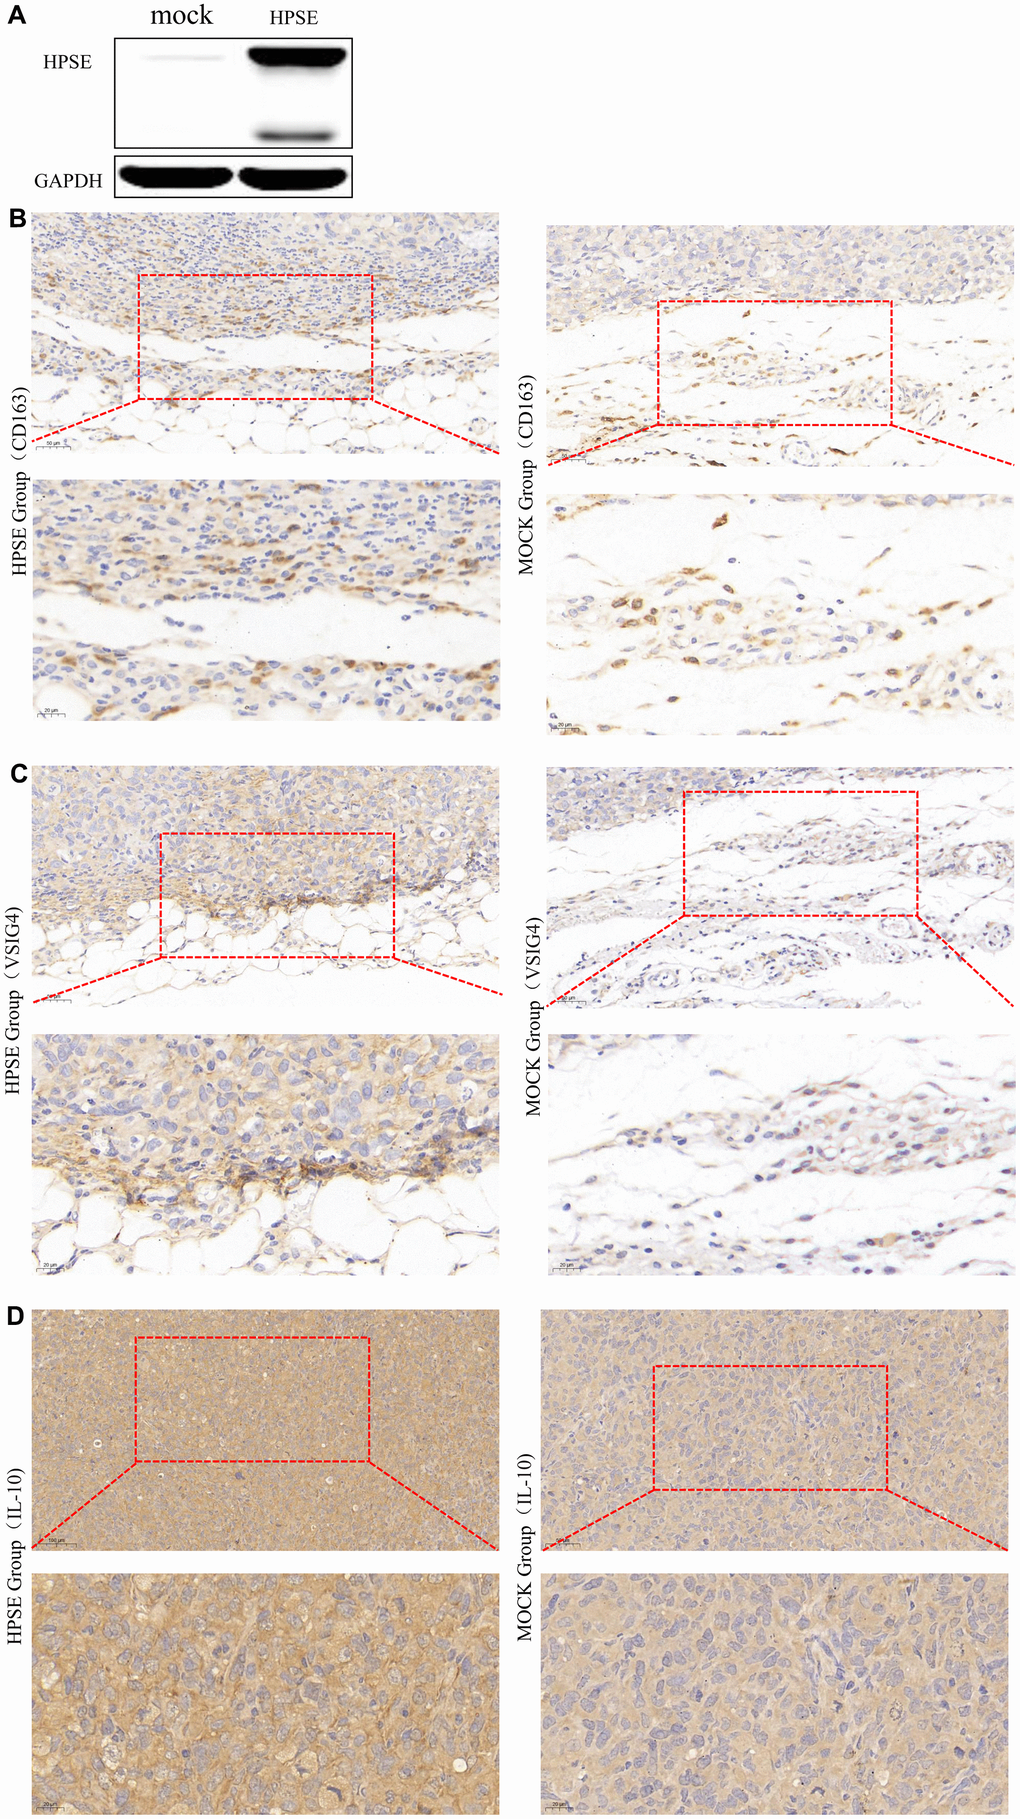
Figure 5.
HPSE expression between MDA-MB-231-HPSE and MDA-MB-231-mock cells (
A
). HPSE expression correlates with IL-10 induced M2 macrophage polarization in a mouse breast tumor model: IHC staining of (
B
) CD163, (
C
) VSIG4, and (
D
) IL-10.