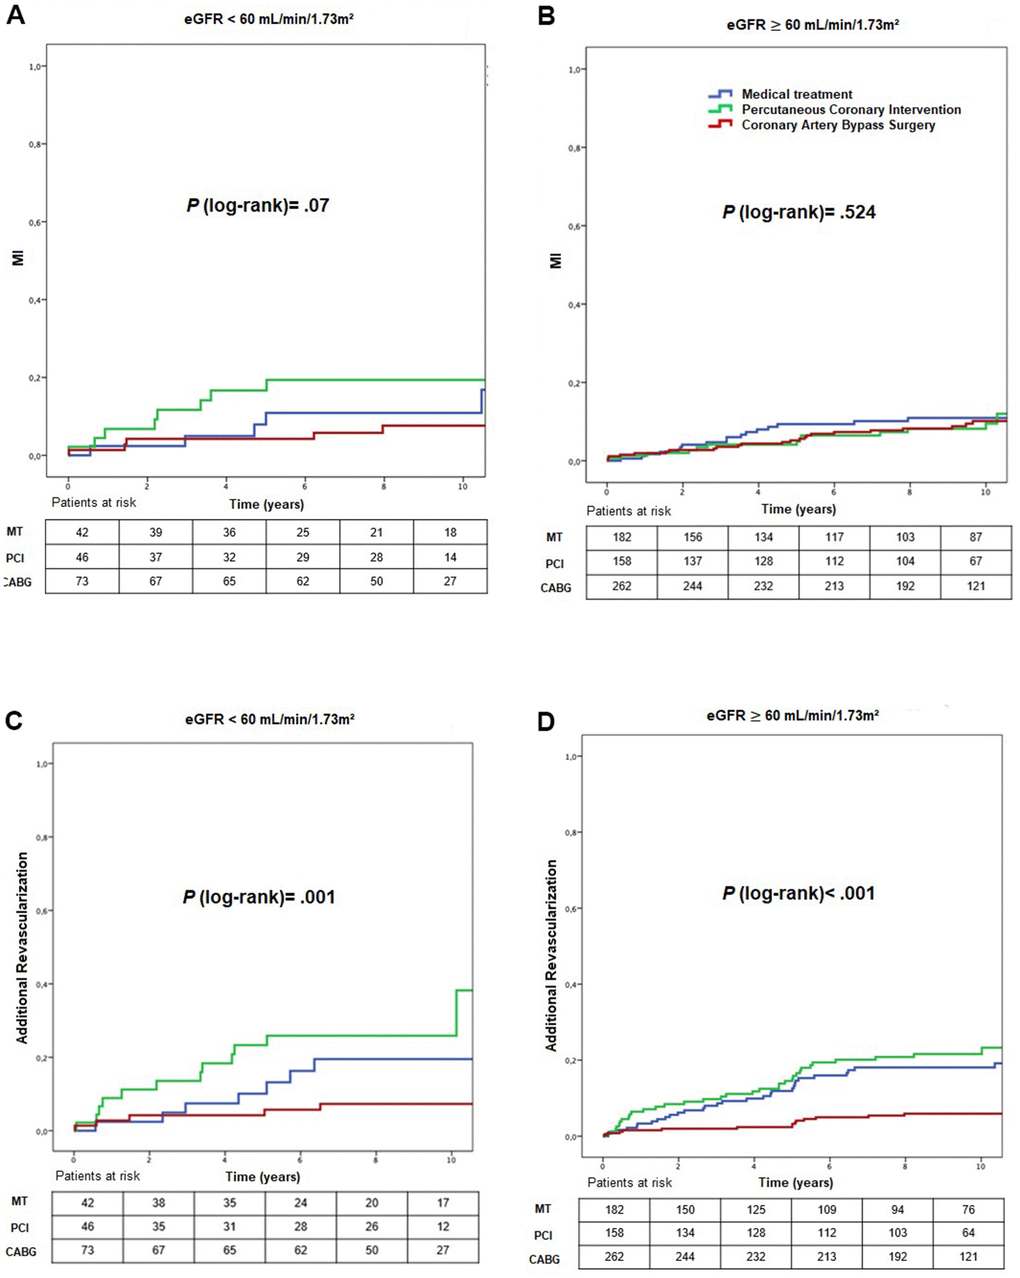
Figure 4.Kaplan-Meier curves showing myocardial infarction (A, B) and additional revascularization (C, D), according to CKD status and treatment group. CABG, coronary artery bypass surgery; eGFR, estimated glomerular filtration rate; MI, myocardial infarction; MT, medical treatment; PCI, percutaneous.