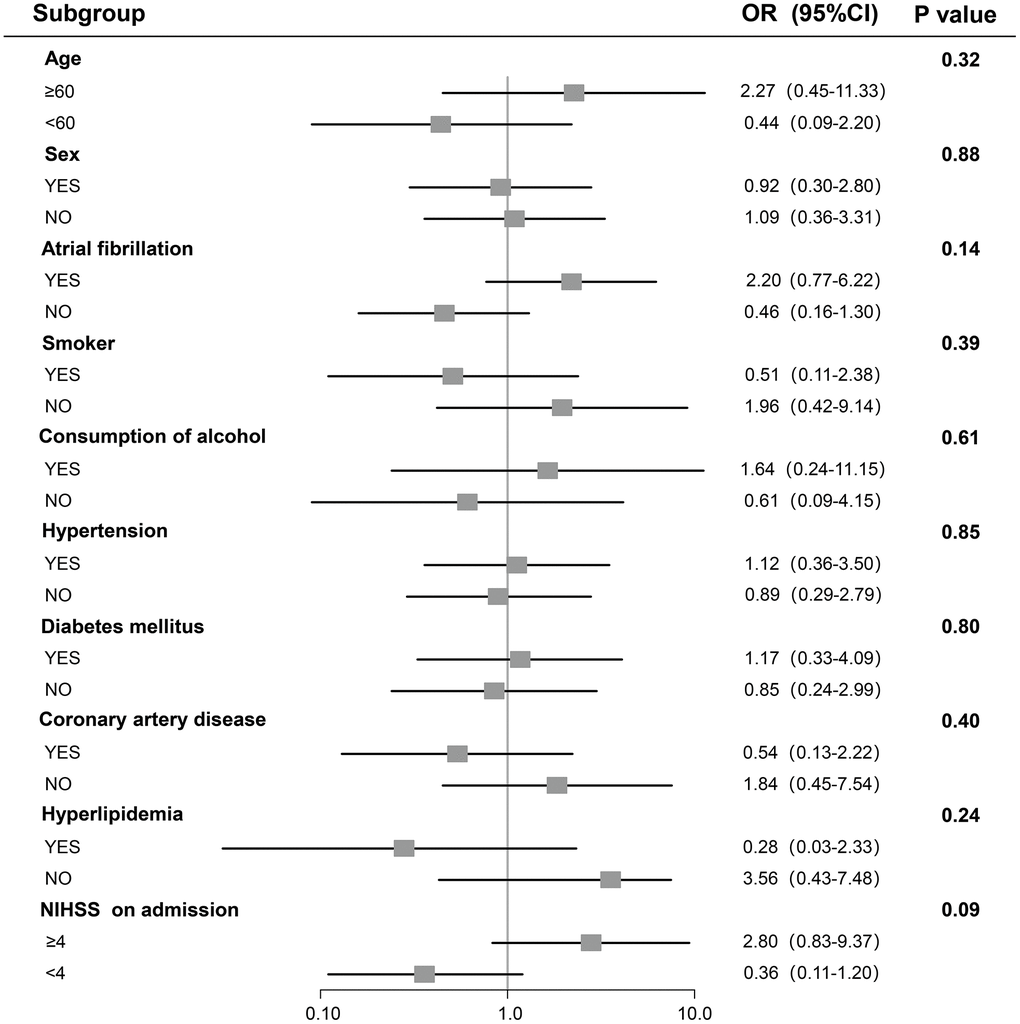
Figure 3.A Result of stratified logistic regression analysis testing association between RDW and hemorrhagic transformation. For subcategories, black squares represent OR, and horizontal lines indicate 95% CI. For baseline NIHSS score, subgroups were dichotomized by median value.