Submit an Article
Navigate
Home
Editorial Board
Editorial Policies
Current Volume
Archive
Scientific Integrity
Publication Ethics Statements
Interviews with Outstanding Authors
Newsroom
Sponsored Conferences
Podcast
Contact
Special Collections
Submit an Article
Online ISSN: 1945-4589
Research Paper
|
Volume 13, Issue 16
|
pp. 20716–20737
N6-methyladenosine (m6A) modification and its clinical relevance in cognitive dysfunctions
Back to article
Figure 7
(7 of 7)
−
100%
+
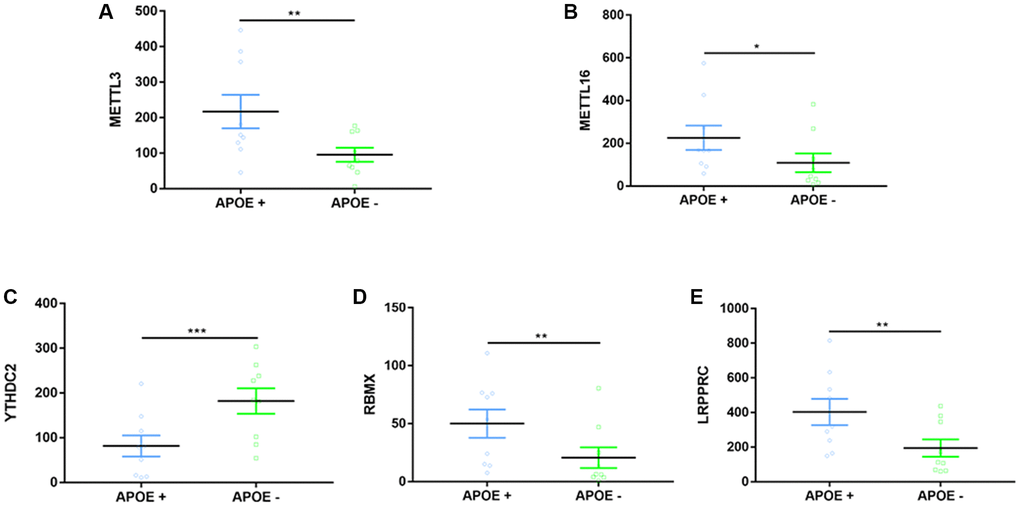
Figure 7.
Expression differences on m6A-related regulators between APOE ɛ4+ and APOE ɛ4− groups.
(
A
–
E
) Five representative DEGs between two groups.
*
p
< 0.05,
**
p
< 0.01,
***
p
< 0.001.