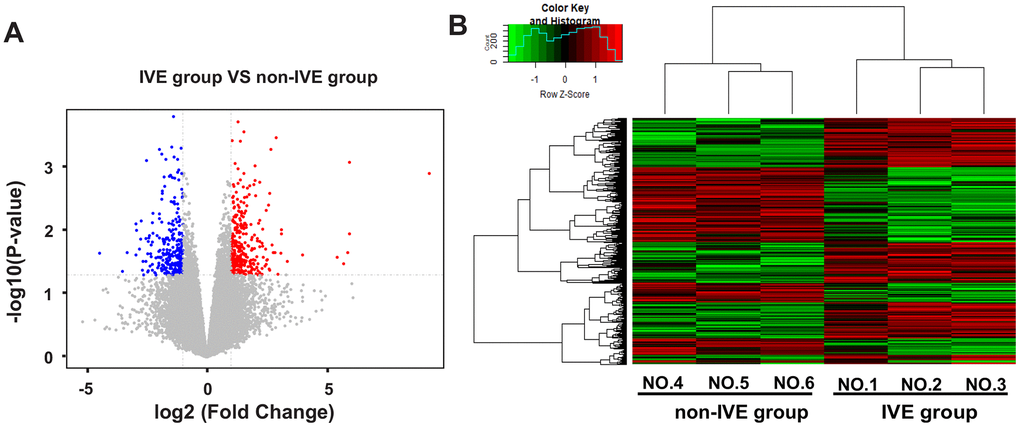
Figure 4.DEGs and hierarchical clustering analysis in the IVE group compared with the non-IVE group. (A) Volcano plot of DEGs between the IVE group and the non-IVE group. Genes significantly up-regulated are highlighted in red while down-regulated genes are highlighted in blue. The P-value threshold and cutoff of absolute fold change were <0.05 and >2, respectively. (B) Heat map clustering of gene expression in cancer tissue resected from six patients. Each column represents 1 individual patient tumor and each row represents 1 gene. Color indicate normalized counts of each gene, with red representing higher expression and green relatively lower expression.