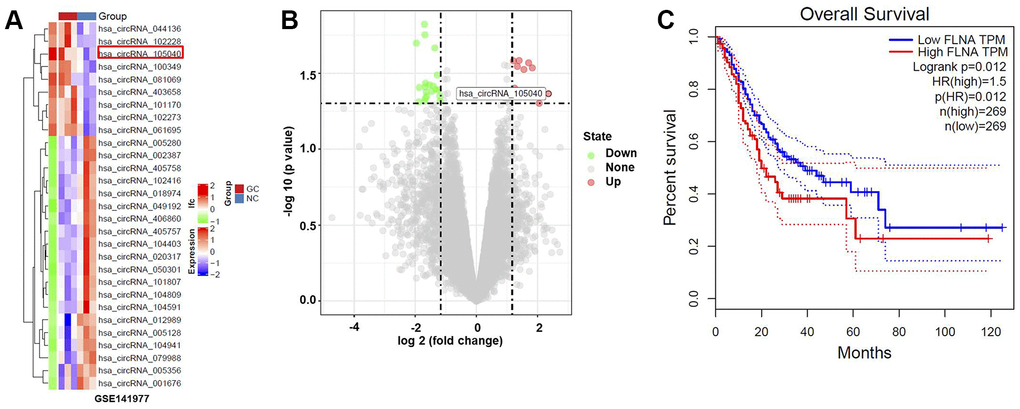
Figure 1.Bioinformatics analysis to identify DEcircRNAs in GC. (A) Heat map indicating DEcircRNAs in GC tissue. (B) Volcano plot of DEcircRNAs. Highly downregulated and upregulated genes indicated in green and red, respectively. P-value < 0.05 (-log10 p-value > 1.3) and |log2(fold change)| > 1.5 were thresholds. (C) Survival analysis demonstrating the relationship between the level of FLNA (the host gene of hsa_circ_0091994) and survival rate of GC patients.