Submit an Article
Navigate
Home
Editorial Board
Editorial Policies
Current Volume
Archive
Scientific Integrity
Publication Ethics Statements
Interviews with Outstanding Authors
Newsroom
Sponsored Conferences
Podcast
Contact
Special Collections
Submit an Article
Online ISSN: 1945-4589
Research Paper
|
Volume 13, Issue 16
|
pp. 19954–19962
COVID-19 mortality rate in children is U-shaped
Back to article
Figure 2
(2 of 6)
−
100%
+
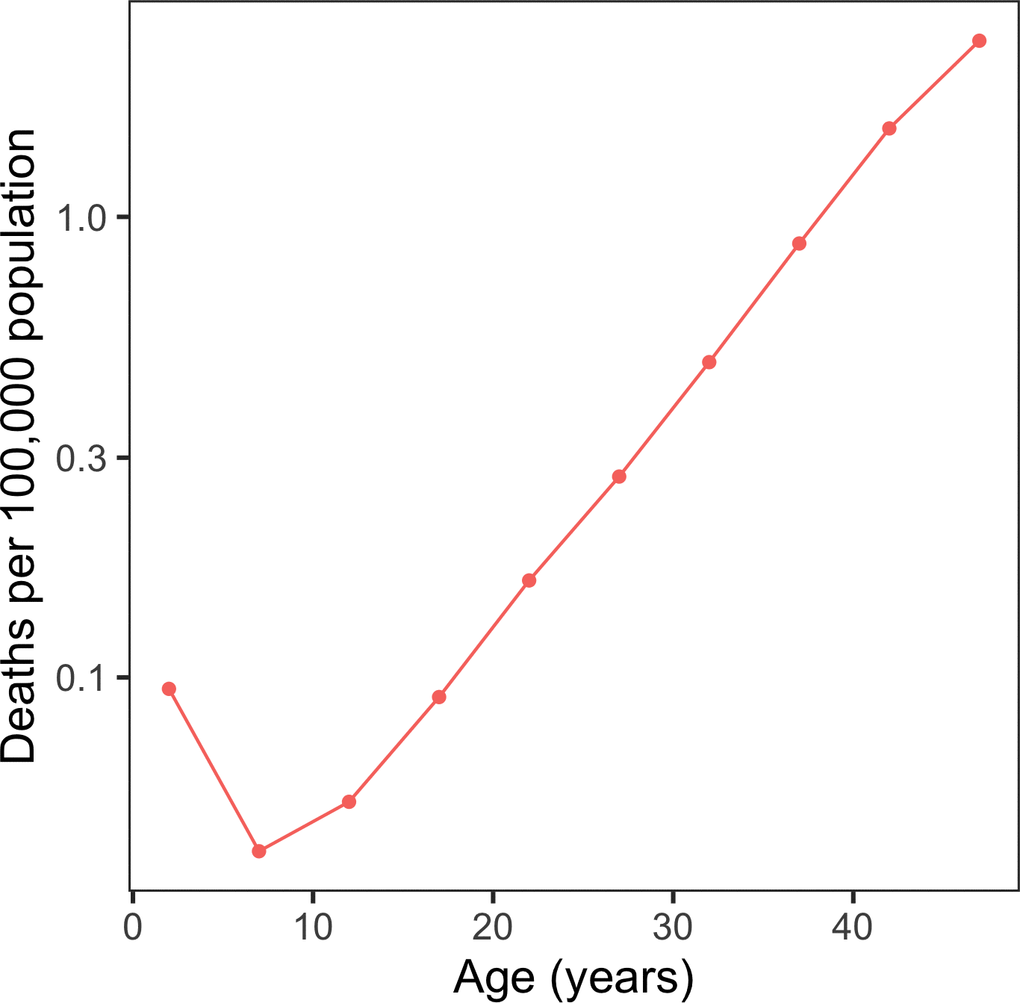
Figure 2.
COVID-19 deaths per 100,000 population in the world.
Shown is the world’s COVID-19 mortality rate per 100,000 people per age interval.