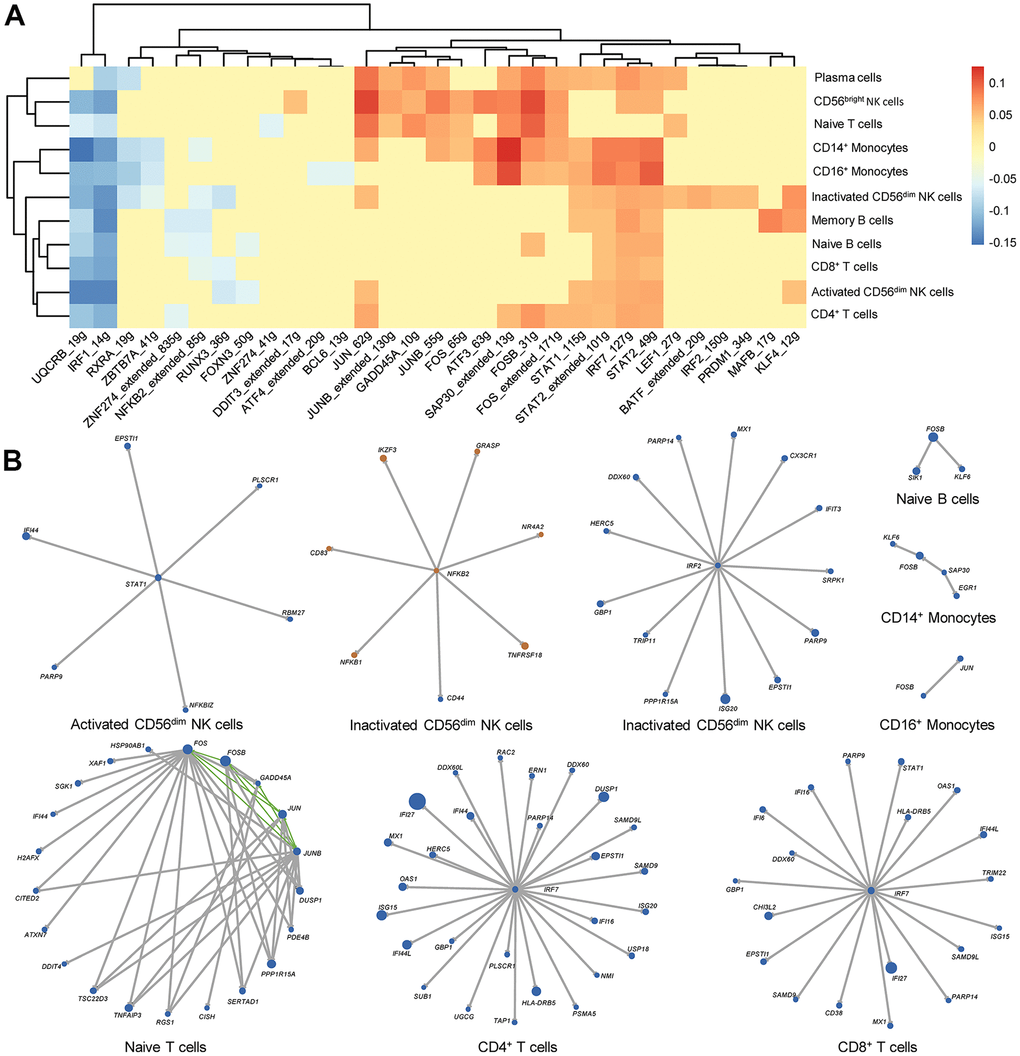
Figure 7.Key transcription factors and gene regulatory networks (GRNs) in each immune cell type from rheumatoid arthritis (RA) peripheral blood. (A) Heat map of differential regulons in each immune cell type. The heat map color indicates the difference in AUC values in RA patients and HCs, and only significantly different regulons are shown in the heat map. Red and blue indicated that the regulon is upregulated and downregulated in RA, respectively. (B) GRNs in each immune cell type. Blue and orange dots represent upregulated and downregulated genes in RA, respectively. The size of the dots corresponds to the absolute value of fold changes. Gray lines and green lines represent unidirectional and bidirectional regulatory relationships, respectively.