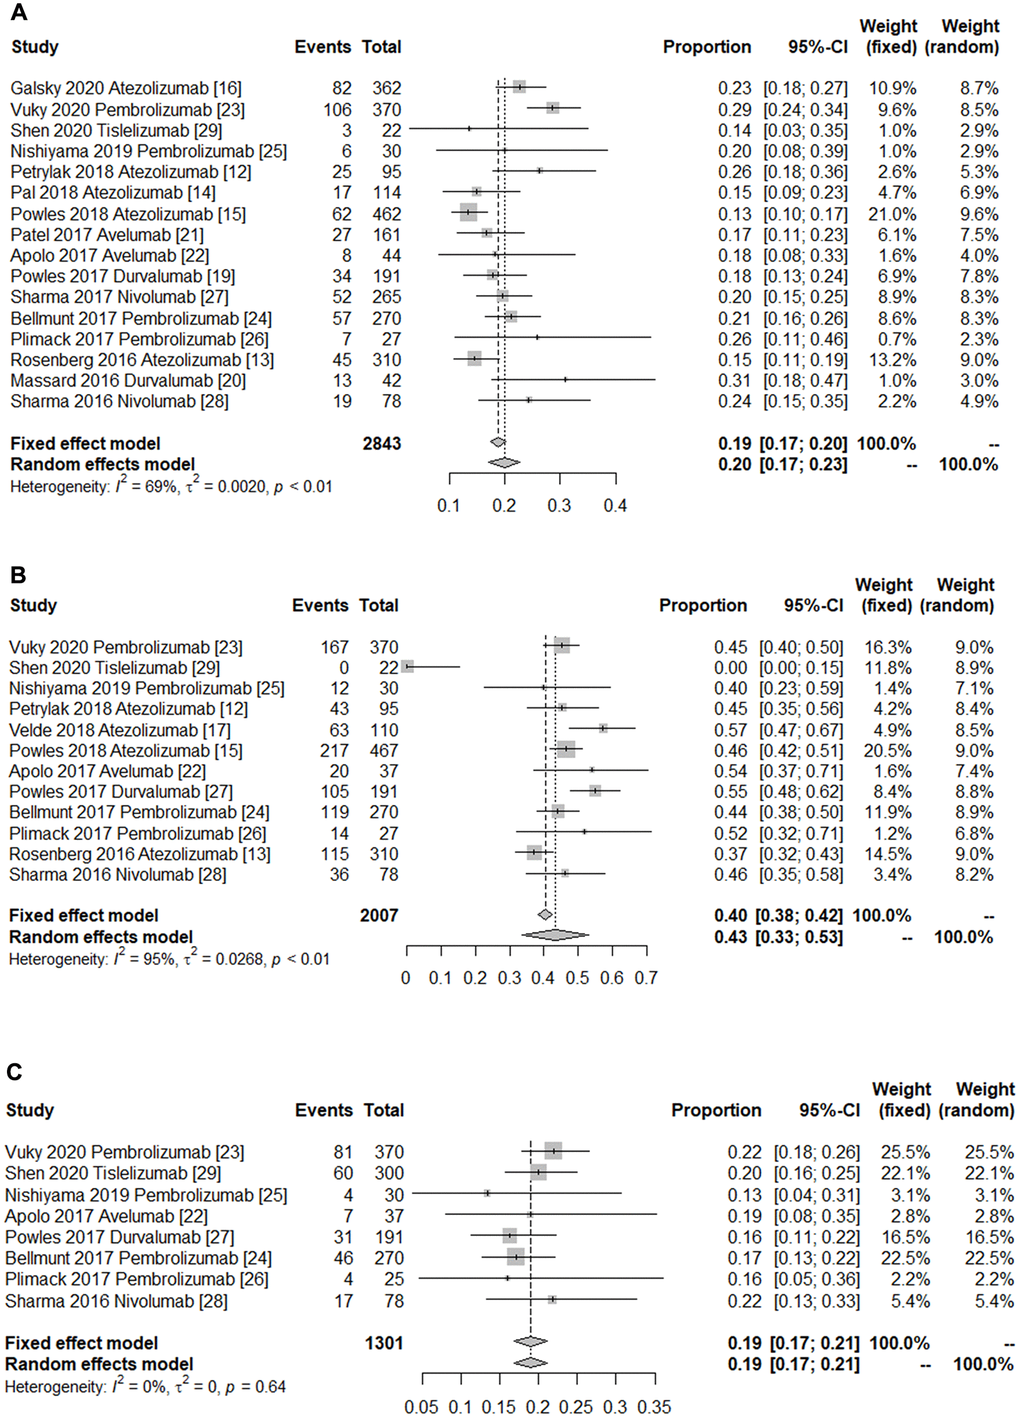
Figure 2.Forest plot of the efficacy of immune checkpoint inhibitors in treating patients with advanced urothelial cancer. (A) Pooled objective response rate. (B) Pooled 1-year overall survival rate. (C) Pooled 1-year progress free survival rate. The diamonds represent the pooled indexes. The line crossing the square represents the 95% CI. I2 indicates the heterogeneity in each subgroup meta-analysis. P demonstrates the significance of differences between the subgroups.