Submit an Article
Navigate
Home
Editorial Board
Editorial Policies
Current Volume
Archive
Scientific Integrity
Publication Ethics Statements
Interviews with Outstanding Authors
Newsroom
Sponsored Conferences
Podcast
Contact
Special Collections
Submit an Article
Online ISSN: 1945-4589
Research Paper
|
Volume 13, Issue 16
|
pp. 20438–20467
Ceruloplasmin correlates with immune infiltration and serves as a prognostic biomarker in breast cancer
Back to article
Figure 9
(9 of 10)
−
100%
+
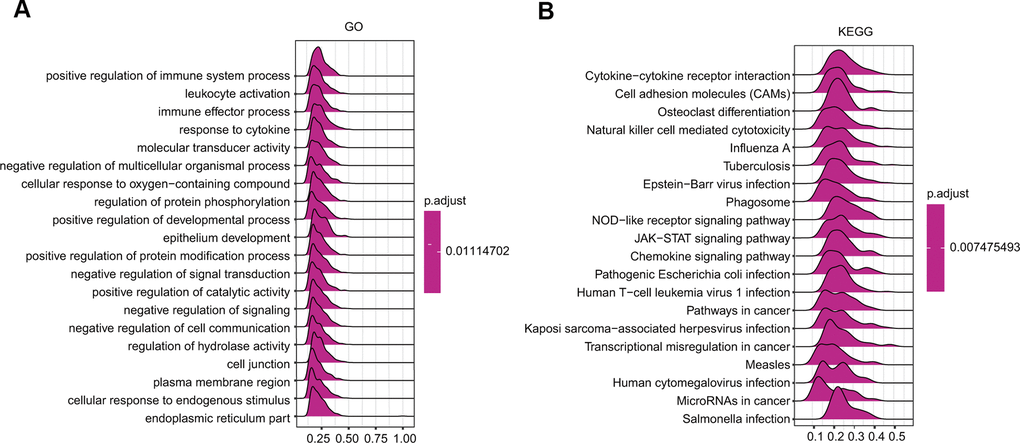
Figure 9.
GSEA results revealing the ceruloplasmin-associated signaling pathways based on KEGG (
A
) and Reactome analyses (
B
) in BRCA.