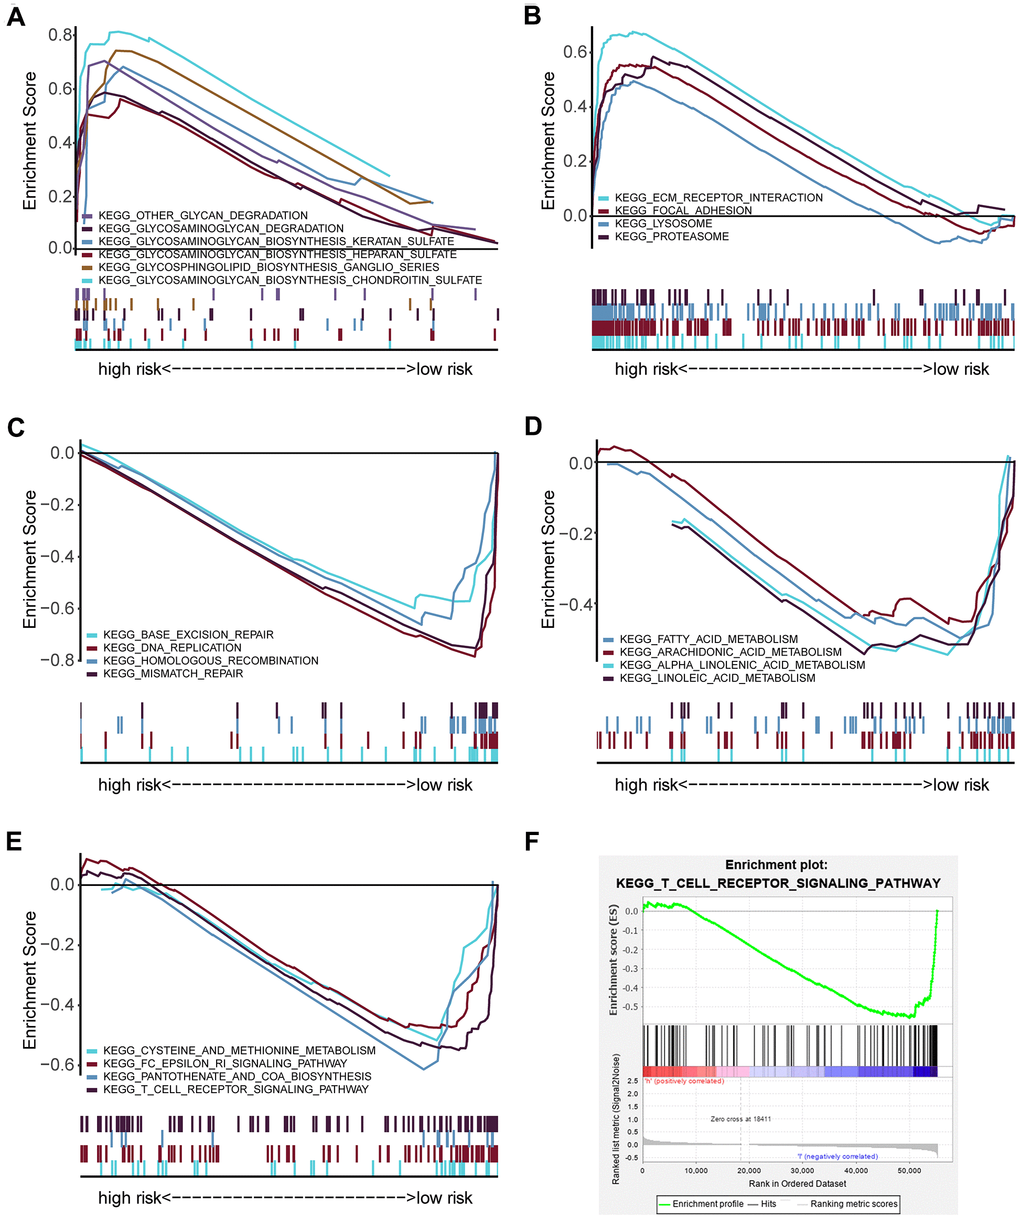
Figure 5.GSEA analysis showing the enriched pathways of the high- and low-risk groups. (A) Multiple GSEA showing glycan-related metabolism pathways in the high-risk group. (B) Multiple GSEA showing extracellular matrix and proteolysis related pathways in the high-risk group. (C) Multiple GSEA showing DNA repair in the low-risk group. (D) Multiple GSEA showing fatty acid metabolism pathways in the low-risk group. (E) Multiple GSEA showing other metabolism- and immune- related pathways in the low-risk group. (F) Single GSEA showing the T cell receptor signaling pathway.