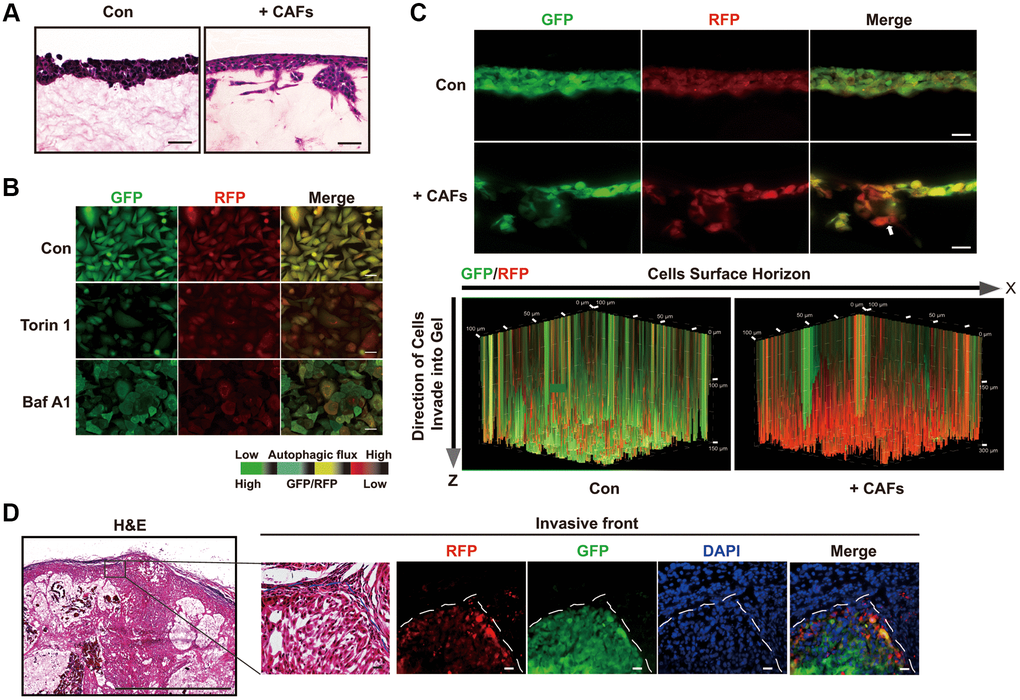
Figure 3.Autophagic degradation and recycling are elevated during the invading process. (A) H&E stained sections of 3D organotypic coculture gels. Scale bars, 50 μm. (B) The GFP/RFP ratio in single A549 cell colonies stable expressing the GFP-LC3-RFP-LC3ΔG cassette was determined under the indicated treatment. Scale bars, 200 μm. (C) Fluorescent images indicating GFP and RFP of A549 cells expressing GFP-LC3-RFP-LC3ΔG in cryosections of paraformaldehyde-fixed organotypic gels (upper panel) and GFP and RFP in a 3D volume rendering of live A549 cells expressing GFP-LC3-RFP-LC3ΔG (lower panel). White arrow, invasive front of A549 cells in the 3D organotypic coculture system. These fluorescent images of the gels in the 3D organotypic coculture system are representative of three independent experiments. Scale bars, 200 μm. The increments on the Z-axis indicate invasion distance (μm). (D) Representative images of H&E staining and GFP/RFP fluorescence in subcutaneous tumors formed by GFP-LC3-RFP-LC3ΔG-expressing A549 cells. Dashed line, tumor-stroma border. Scale bar, 200 μm for H&E staining and 50 μm for fluorescence images.