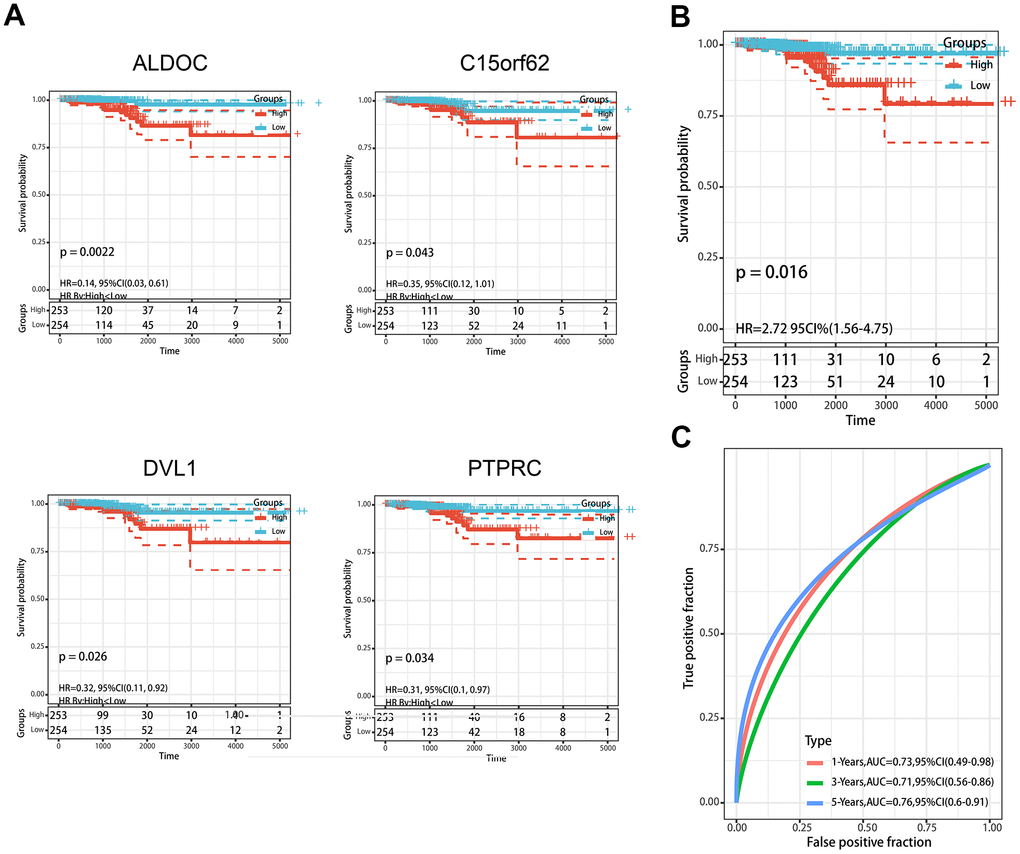
Figure 3.Construction of MDGs based prognostic signature. (A) Kaplan-Meier plots of ALDOC, C14orf62, DVL1, PTPRC. (B) The Kaplan-Meier plot of the prognostic signature based on the median of the risk score. (C) The ROC curve for assessing the prediction value of the signature.