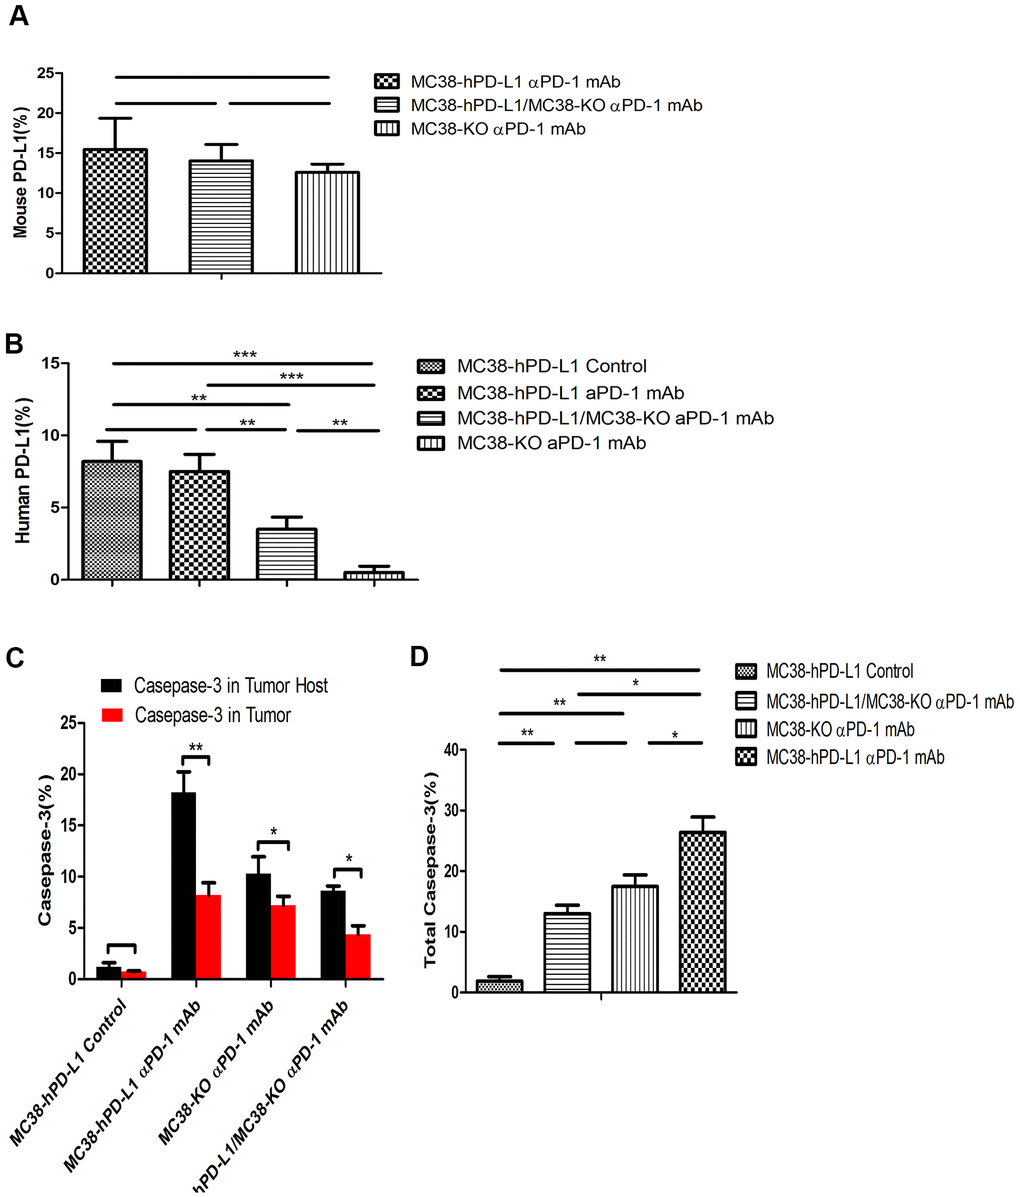
Figure 6.Fluorescence quantitative analysis. (A) Percentage of mouse PD-L1(PD-L1 in the host) among the different tumors. (B) Percentage of human PD-L1(PD-L1 in Tumor) among the different tumors. (C) Percentage of caspase-3 in tumor or tumor-host among the different tumors. (D) Percentage of total caspase-3 among the different tumors. ***P <0.001, **P <0.01, *P <0.05.