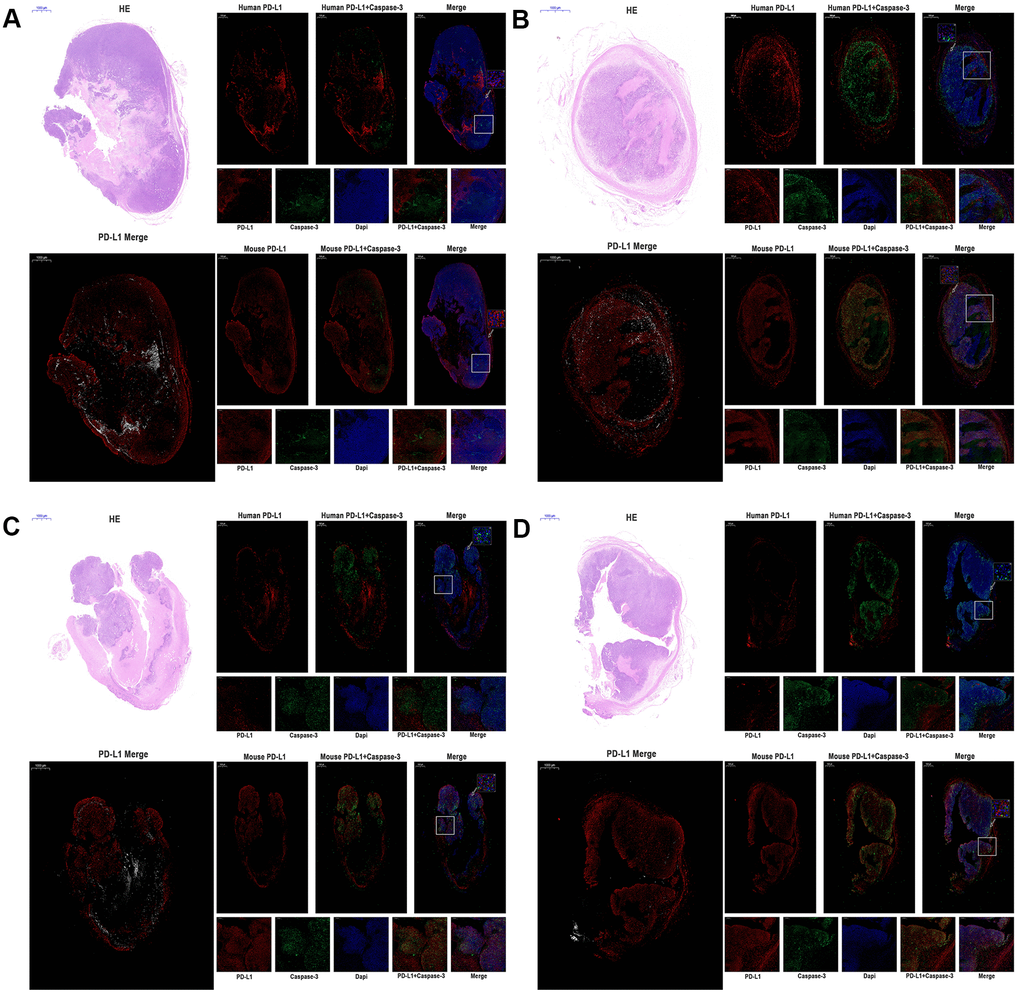
Figure 5.The expression of human PD-L1, mouse PD-L1, and Caspase-3 were detected by immunofluorescence of MC38 tumors (n=3, Scale bar=1000 μm). (A) MC38-hPD-L1 control (B) MC38-hPD-L1 (C) MC38-hPD-L1/KO (D) MC38-KO Human PD-L1 or Mouse PD-L1 was indicated by red signals; Caspase-3 in tumor or tumor-host was indicated by green signals; nuclei, blue 4’,6-diamidino-2-phenylindole (DAPI) signals. HE staining: upper left. PD-L1 Merge: lower left (Mouse PD-L1, red; Human PD-L1, gray). Local amplifies the area indicated by the white box. Scale bar=200 μm. Inset amplifies the area indicated by the white arrow. Scale bar=50 μm.