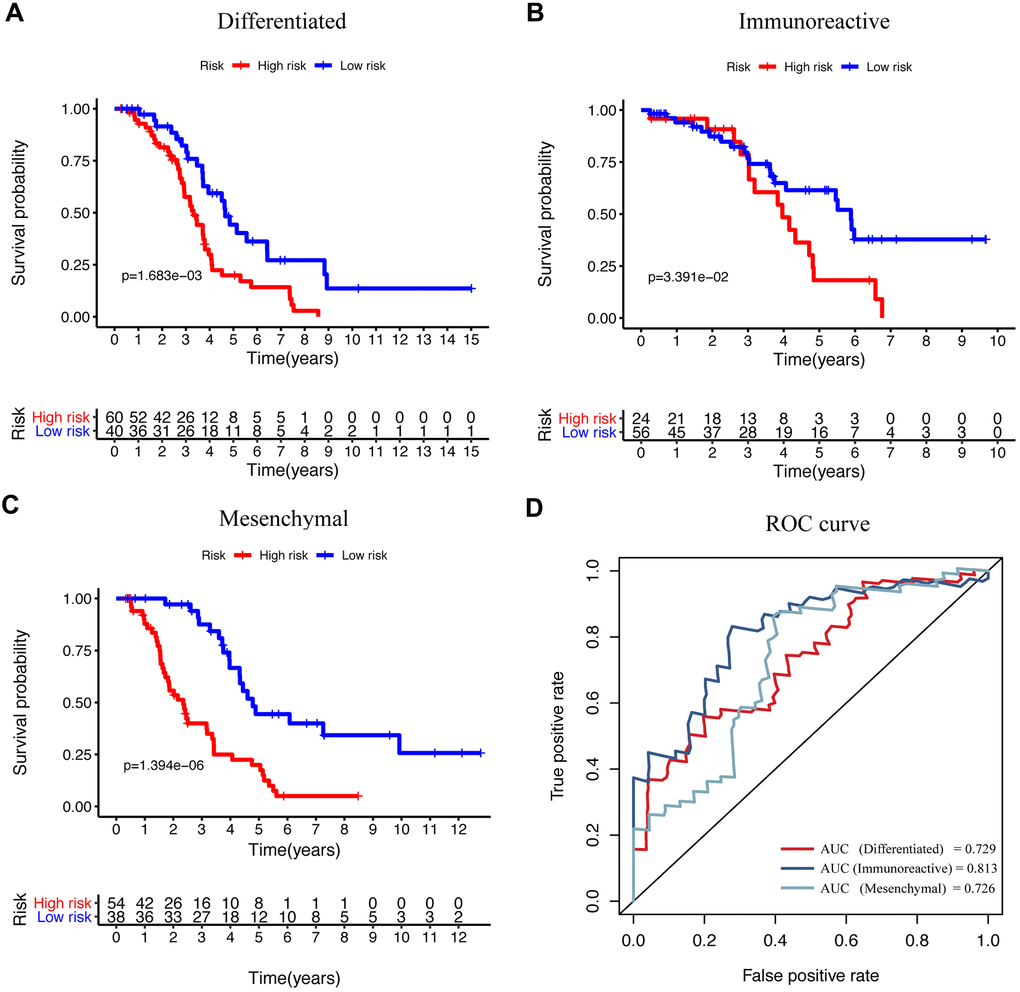
Figure 6.The efficacy of signature in diverse subtypes according to the differentiated expressed genes. (A–C) KM curve analysis of the high-risk and low-risk groups in “differentiated,” “immunoreactive,” and “mesenchymal” subtypes. (D) Time-dependent ROC curve analysis of the prognostic model in “differentiated,” “immunoreactive,” and “mesenchymal” subtypes.