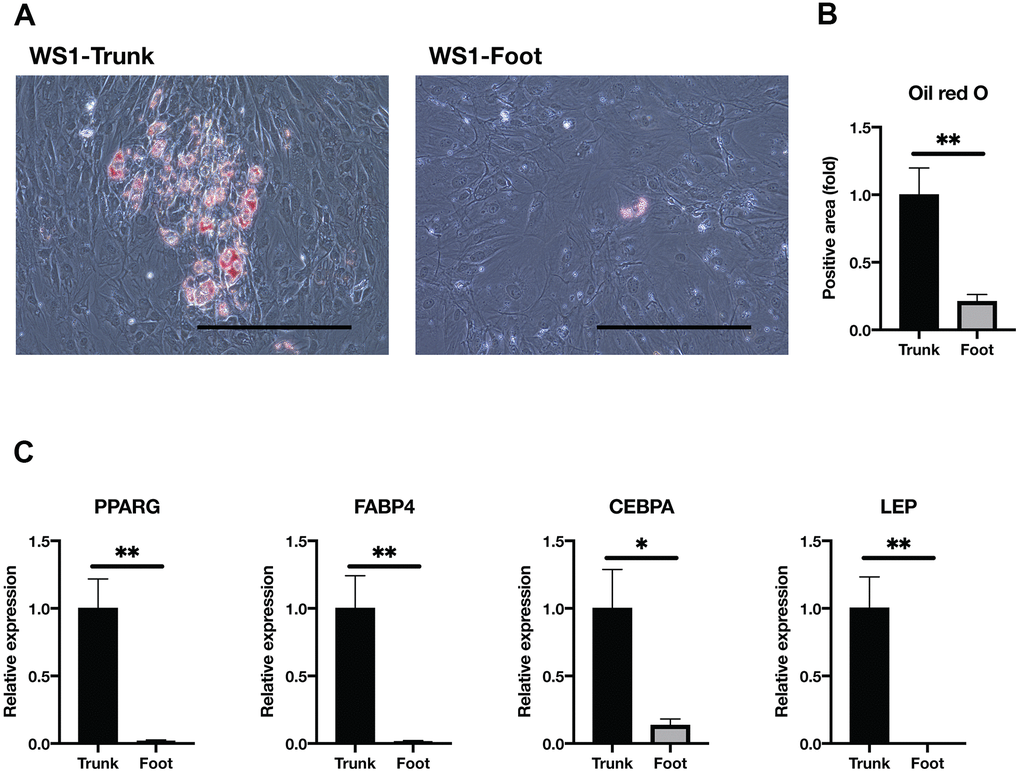
Figure 3.Adipogenesis was impaired in the foot fibroblasts. (A) Representative images of Oil red O staining after two weeks induction of adipogenesis in the trunk and foot fibroblasts of WS1. Bar = 300 μm. (B) Quantification of relative Oil red O staining area. Data are means ± SEM of two patients from four microscopic views. For statistical analysis, student t-test was performed (**p<0.01). (C) Relative gene expression analyzed by qRT-PCR. Data are means ± SEM of two patients with three technical replicates. For statistical analysis, student t-test was performed (*p<0.05; **p<0.01).