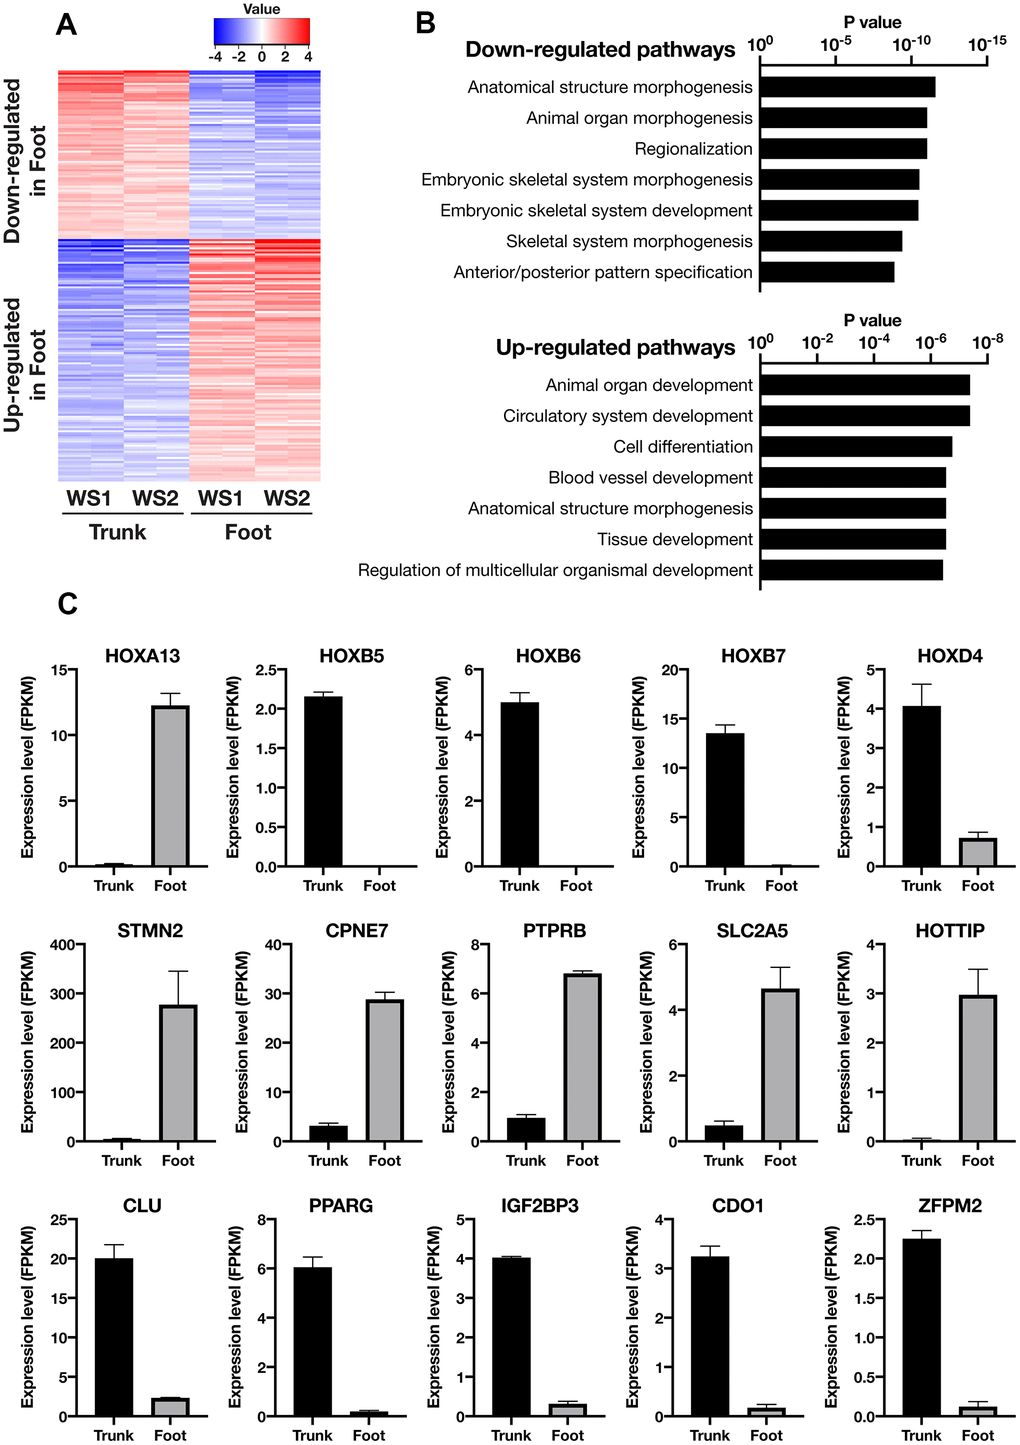
Figure 2.Transcriptome analysis showed distinct gene expression profiles between the trunk and foot fibroblasts. (A) Heatmap of differentially expressed genes between the trunk and foot. Cutoff: |log2(Foot/Trunk)| > 1 and FDR < 0.05. (B) List of the top seven Gene Ontology (GO: biological process) terms and corresponding p values related to Figure 2A. (C) Differentially expressed genes specifically involved in embryonic development and mesenchymal cell differentiation. Data are means ± SEM of two patients (technically n=2 in each sample).
Figure 2 — Fibroblasts from different body parts exhibit distinct phenotypes in adult progeria Werner syndrome | Aging