Submit an Article
Navigate
Home
Editorial Board
Editorial Policies
Current Volume
Archive
Scientific Integrity
Publication Ethics Statements
Interviews with Outstanding Authors
Newsroom
Sponsored Conferences
Podcast
Contact
Special Collections
Submit an Article
Online ISSN: 1945-4589
Research Paper
|
Volume 13, Issue 4
|
pp. 4811–4830
Chemical composition and pharmacological mechanism of ephedra-glycyrrhiza drug pair against coronavirus disease 2019 (COVID-19)
Back to article
Figure 1
(1 of 10)
−
100%
+
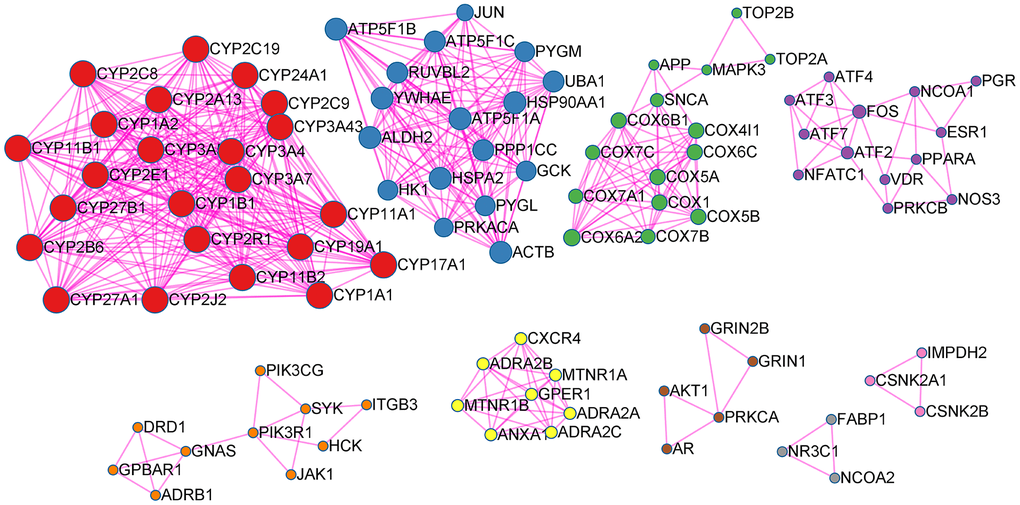
Figure 1.
EG PPI network.
Points represent targets, lines represent interaction relationships and different colors represent different clusters.
Figure 1 — Chemical composition and pharmacological mechanism of ephedra-glycyrrhiza drug pair against coronavirus disease 2019 (COVID-19) | Aging