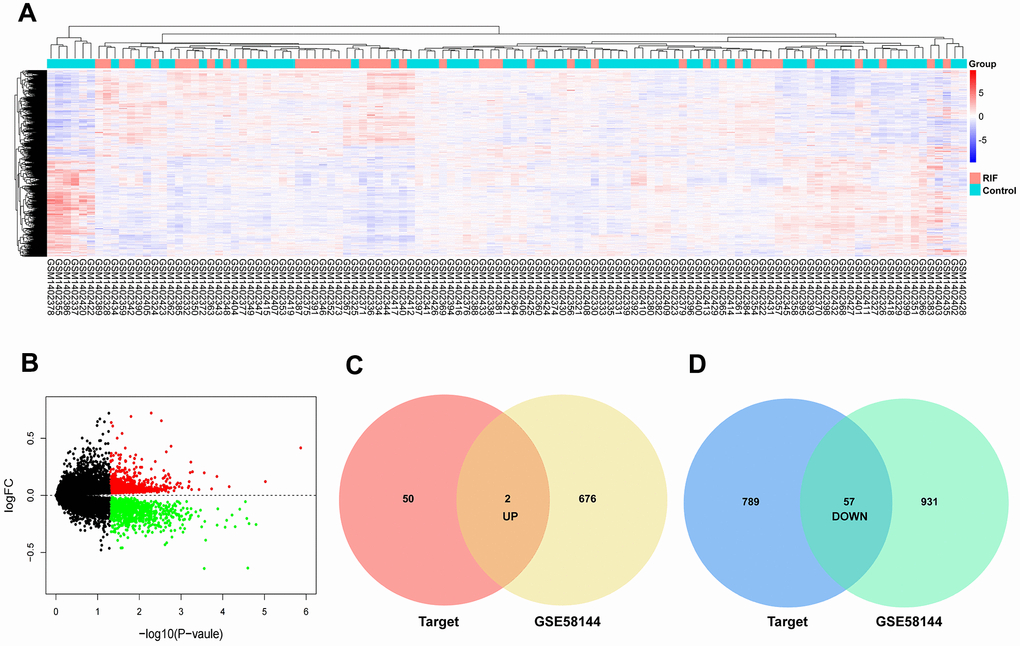
Figure 4.Identification of differentially expressed mRNAs. (A) Heatmap of the differentially expressed mRNAs in GSE58144. (B) Volcano map for all mRNAs in GSE58144. (C, D) Venn diagram analysis of DEmRNA-predicted targets and differentially expressed mRNAs in GEO.