Submit an Article
Navigate
Home
Editorial Board
Editorial Policies
Current Volume
Archive
Scientific Integrity
Publication Ethics Statements
Interviews with Outstanding Authors
Newsroom
Sponsored Conferences
Podcast
Contact
Special Collections
Submit an Article
Online ISSN: 1945-4589
Research Paper
|
Volume 13, Issue 5
|
pp. 7133–7146
Clinical features and prognostic factors of elderly patients with metastatic pancreatic cancer: a population-based study
Back to article
Figure 2
(2 of 2)
−
100%
+
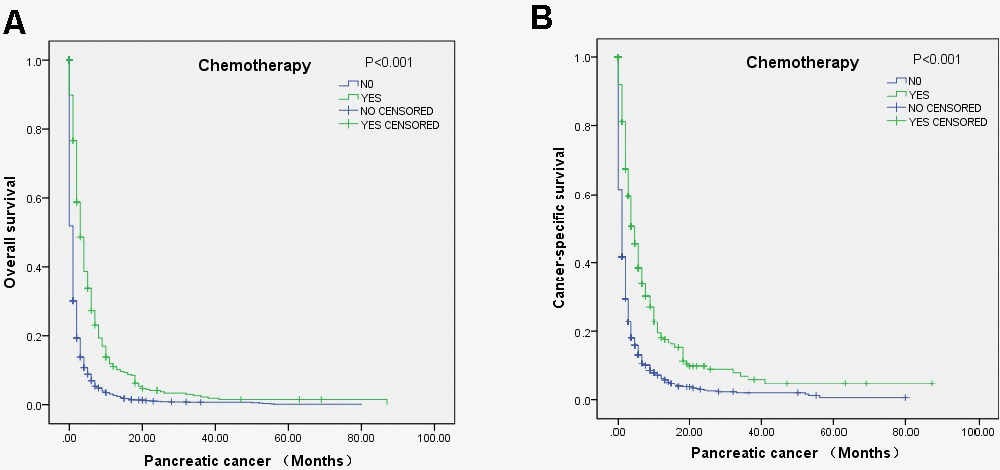
Figure 2.
Survival curves of elderly mPC patients over 80 years old who received chemotherapy according to the log-rank test: (
A
) OS (p<0.001) and (
B
) CSS (P<0.001).