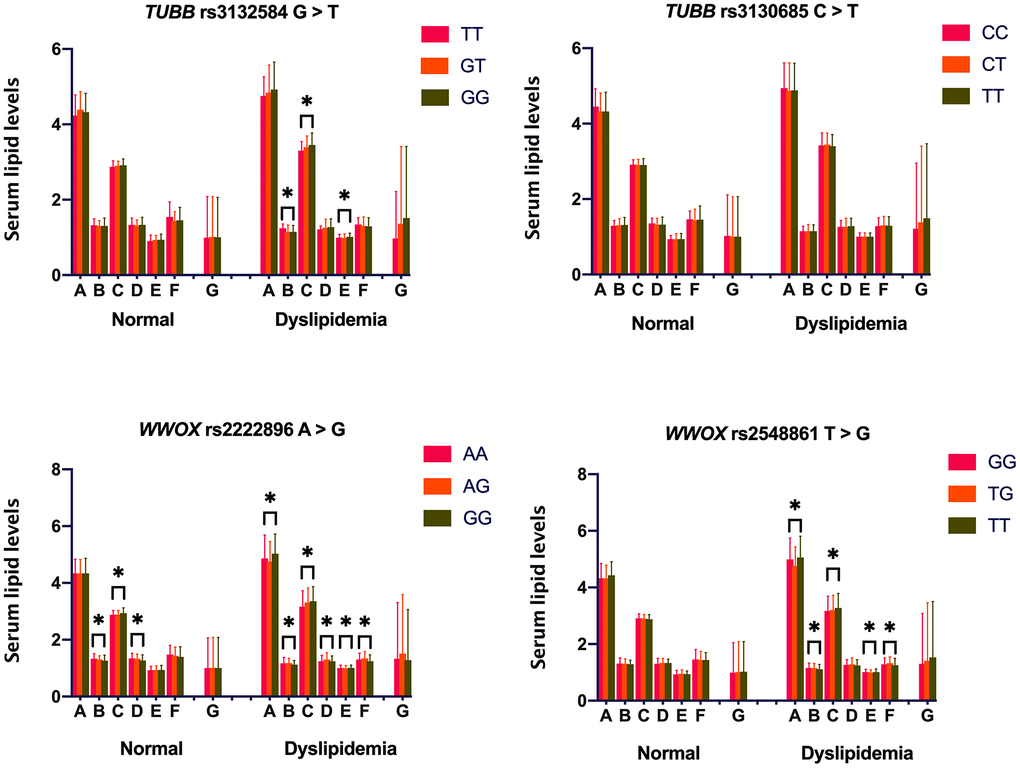
Figure 1.Associations between TUBB-WWOX genotypes and serum lipid levels in normal and dyslipidemia groups. A = Total cholesterol (mM); B = High-density lipoprotein cholesterol (mM); C = Low-density lipoprotein cholesterol (mM); D = Apolipoprotein (Apo) A1 (g/L); E = ApoB (g/L); F = ApoA1/ApoB ratio; and G = Triglyceride (mM). *P-value < 0.006 indicated a statistically significant difference after Bonferroni correction.