Submit an Article
Navigate
Home
Editorial Board
Editorial Policies
Current Volume
Archive
Scientific Integrity
Publication Ethics Statements
Interviews with Outstanding Authors
Newsroom
Sponsored Conferences
Podcast
Contact
Special Collections
Submit an Article
Online ISSN: 1945-4589
Research Paper
|
Volume 13, Issue 4
|
pp. 5845–5857
Down-regulation of estrogen-related receptor alpha (ERRα) inhibits gastric cancer cell migration and invasion
in vitro
and
in vivo
Back to article
Figure 3
(3 of 8)
−
100%
+
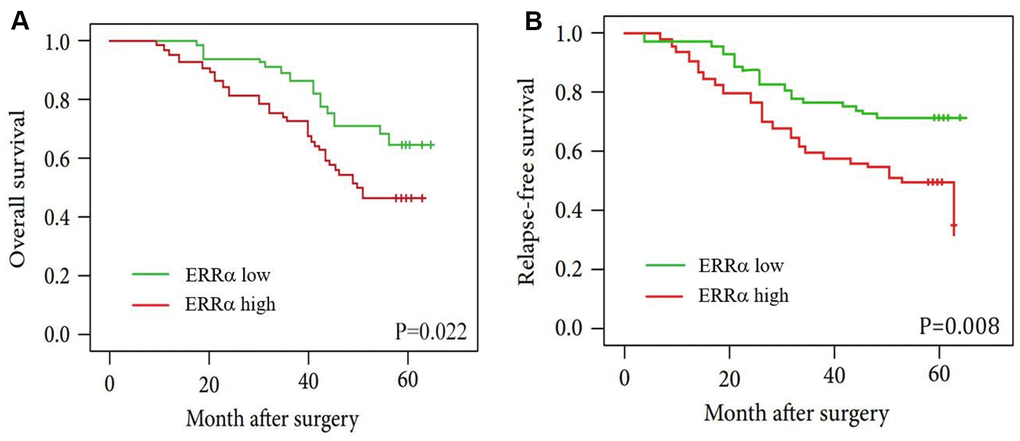
Figure 3.
Kaplan-Meier curves for patients with low ERRα expression versus high ERRα expression.
(
A
) OS curves of patients with low and high expression of ERRα, P=0.022; (
B
) RFS curves of patients with low and high expression of ERRα, P=0.008.