Submit an Article
Navigate
Home
Editorial Board
Editorial Policies
Current Volume
Archive
Scientific Integrity
Publication Ethics Statements
Interviews with Outstanding Authors
Newsroom
Sponsored Conferences
Podcast
Contact
Special Collections
Submit an Article
Online ISSN: 1945-4589
Research Paper
|
Volume 13, Issue 1
|
pp. 204–218
Telomere length as a function of age at population level parallels human survival curves
Back to article
Figure 3
(3 of 5)
−
100%
+
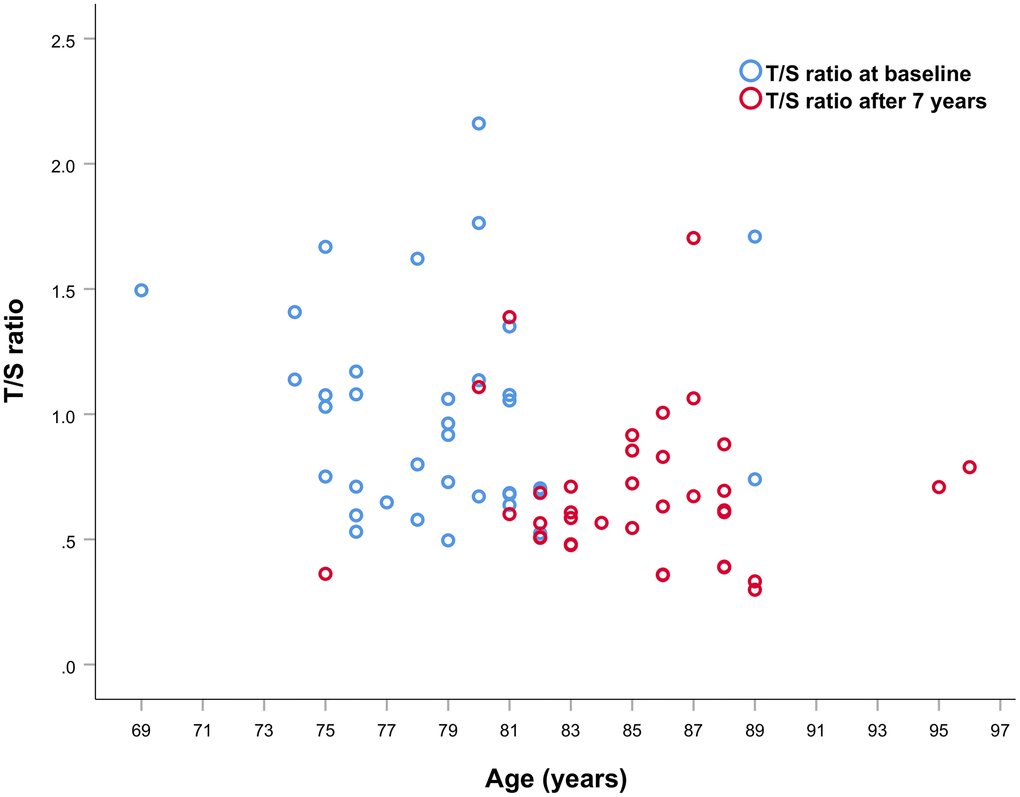
Figure 3.
Scatter plot of T/S ratio values at first and second sampling of the 36 subjects analyzed.