Submit an Article
Navigate
Home
Editorial Board
Editorial Policies
Current Volume
Archive
Scientific Integrity
Publication Ethics Statements
Interviews with Outstanding Authors
Newsroom
Sponsored Conferences
Podcast
Contact
Special Collections
Submit an Article
Online ISSN: 1945-4589
Research Paper
|
Volume 13, Issue 4
|
pp. 5686–5697
Identification of hub genes associated with adult acute myeloid leukemia progression through weighted gene co-expression network analysis
Back to article
Figure 6
(6 of 6)
−
100%
+
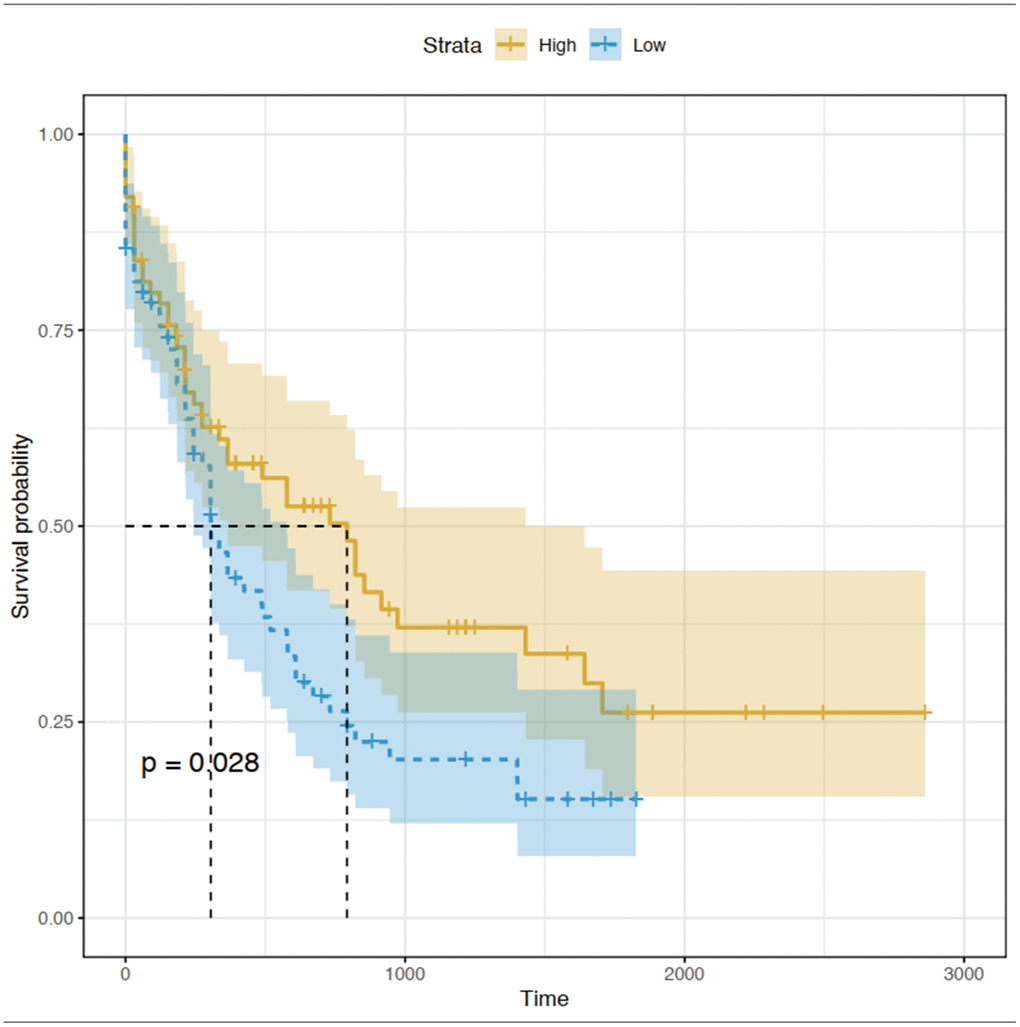
Figure 6.
Kaplan-Meier curve for CEACAM5 low and high expression patients in TCGA database.
Figure 6 — Identification of hub genes associated with adult acute myeloid leukemia progression through weighted gene co-expression network analysis | Aging