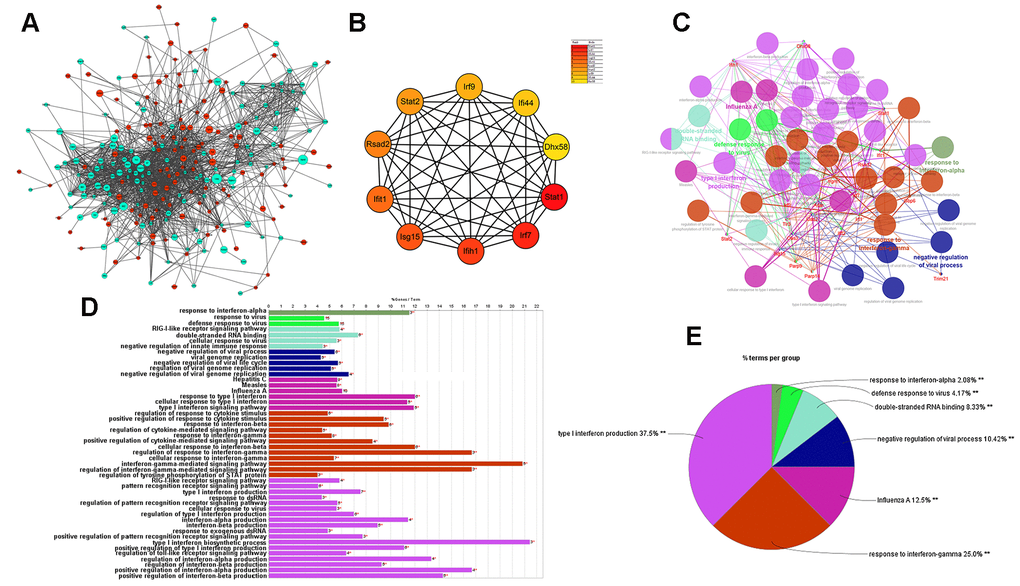
Figure 7.Results of analysis of the PPI network associated with atherosclerosis. (A) The PPI network of DEGs associated with atherosclerosis. The green circles represent down-regulated DEG-encoded proteins and the red circles represent upregulated DEG-encoded proteins. The size of the circle indicates the abundance of gene expression. (B) The top 10 hub genes in the PPI network by MCC method. (C–E) A function subnet module analysis performed by ClueGO. Terms are presented in different colors. PPI, Protein–Protein Interaction.