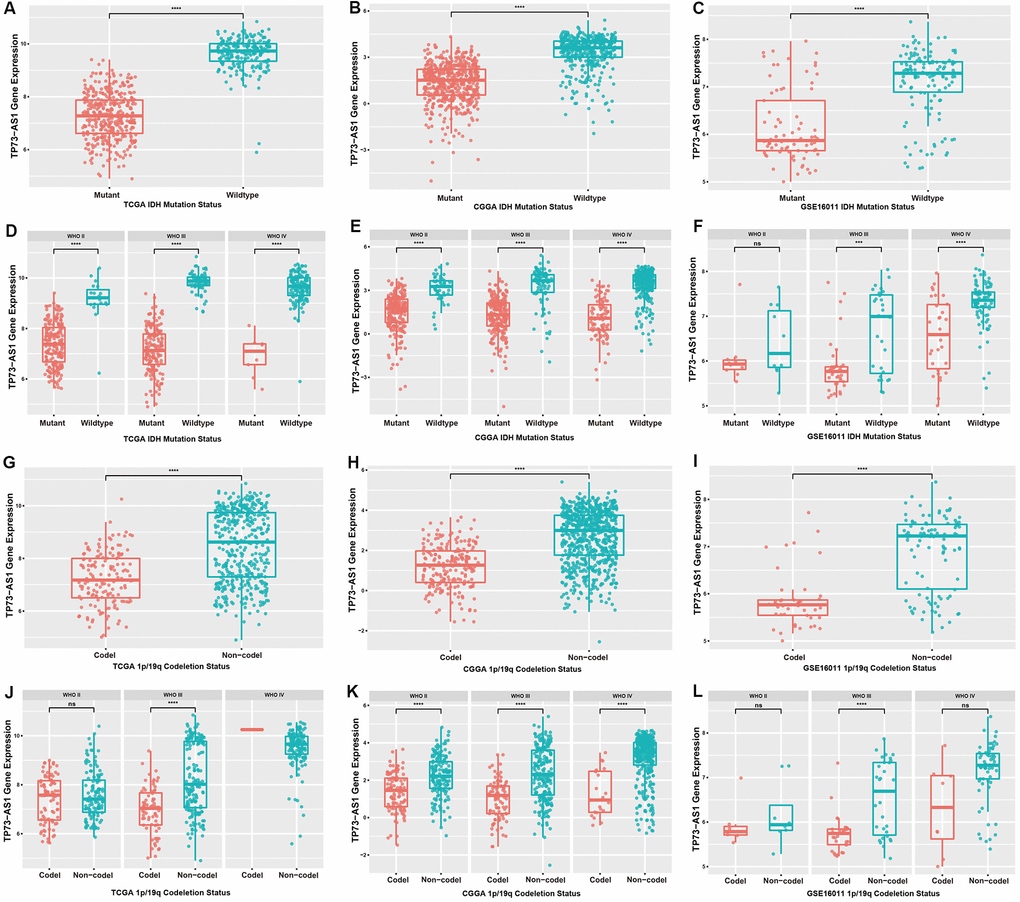
Figure 2.Expression levels of TP73-AS1 in gliomas with different IDH and 1p/19q statuses. (A–C) Expression levels of TP73-AS1 for different statuses of IDH in all WHO grades in the TCGA (A), CGGA (B), and GSE16011 (C) datasets. (D–F) Expression levels of TP73-AS1 for different statuses of IDH in all WHO grades in the TCGA (D), CGGA (E), and GSE16011 (F) datasets. (G–I) Expression levels of TP73-AS1 for different statuses of 1p/19q co-deletion in all WHO grades in the TCGA (G), CGGA (H), and GSE16011 (I) datasets. (J–L) Expression levels of TP73-AS1 for different statuses of 1p/19q co-deletion in all WHO grades in the TCGA (J), CGGA (K), and GSE16011 (L) datasets.