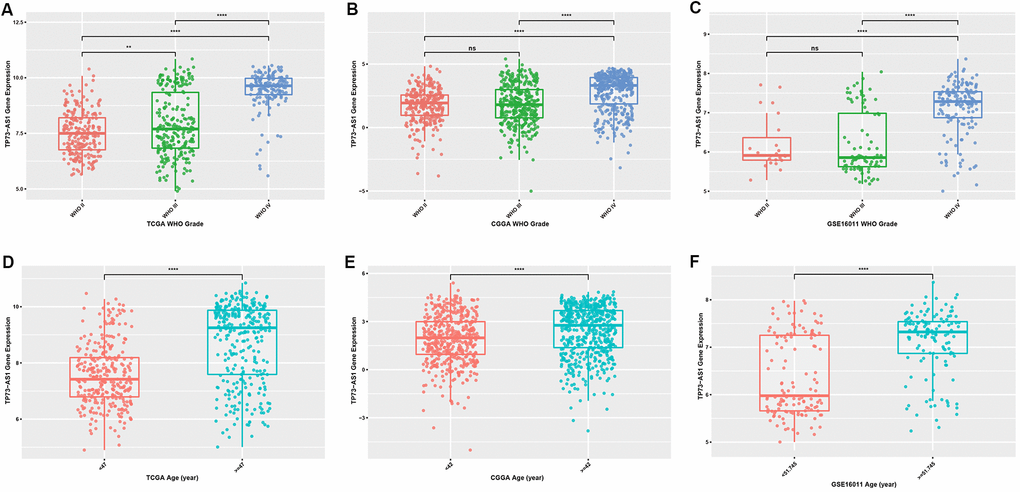
Figure 1.Expression levels of TP73-AS1 in gliomas with different clinicopathological features (A–C) Expression levels of TP73-AS1 in different WHO grades in the TCGA (A), CGGA (B), and GSE16011 (C) datasets. (D–F) Expression levels of TP73-AS1 in different age groups in the TCGA (D), CGGA (E), and GSE16011 (F) datasets.