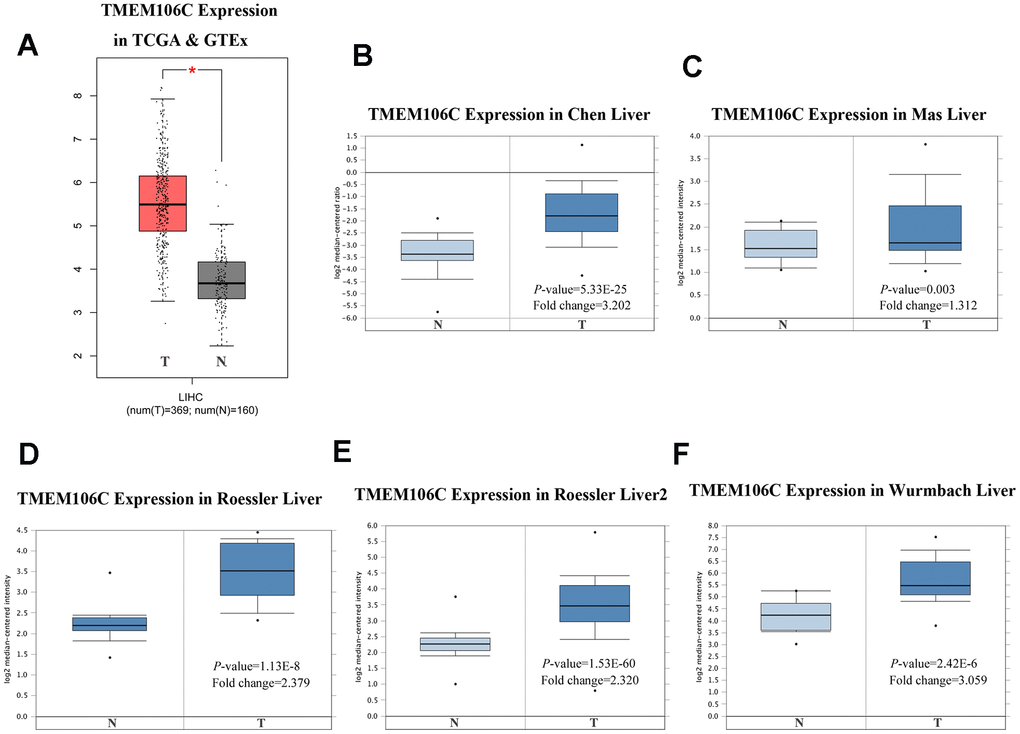
Figure 1.TMEM106C transcription in tumor tissues HCC (GEPIA and Oncomine). (A) Boxplot showing TMEM106C mRNA levels in TCGA and GTEx from GEPIA. *P < 0.05. (B–F) Boxplot showing TMEM106C mRNA levels in Chen Liver, MasLiver, RoesslerLiver, RoesslerLiver2, and Wurmbach Liver datasets from Oncomine. (T=tumor, N=normal).