Submit an Article
Navigate
Home
Editorial Board
Editorial Policies
Current Volume
Archive
Scientific Integrity
Publication Ethics Statements
Interviews with Outstanding Authors
Newsroom
Sponsored Conferences
Podcast
Contact
Special Collections
Submit an Article
Online ISSN: 1945-4589
Research Paper
|
Volume 13, Issue 4
|
pp. 5539–5552
Development and validation of RNA binding protein-applied prediction model for gastric cancer
Back to article
Figure 8
(8 of 8)
−
100%
+
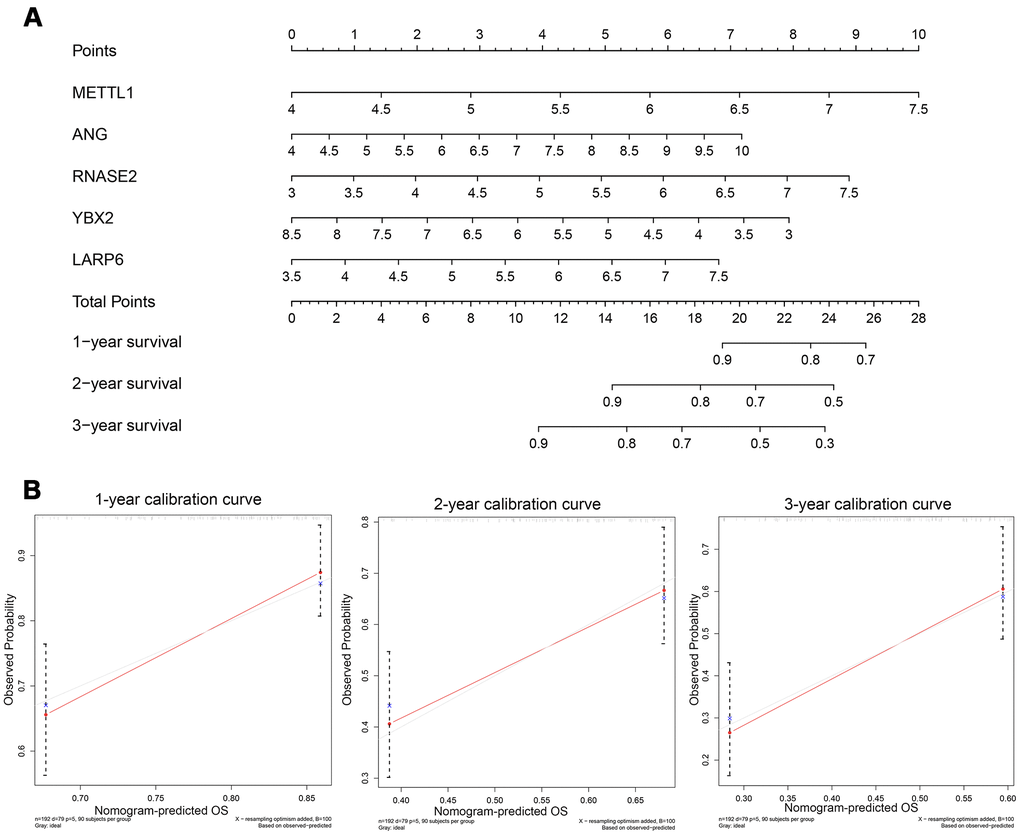
Figure 8.
(
A
) Nomogram to predict the risk of GC patients; (
B
) Calibration curves for the prediction of 1-, 2- or 3-year overall survival.
Figure 8 — Development and validation of RNA binding protein-applied prediction model for gastric cancer | Aging