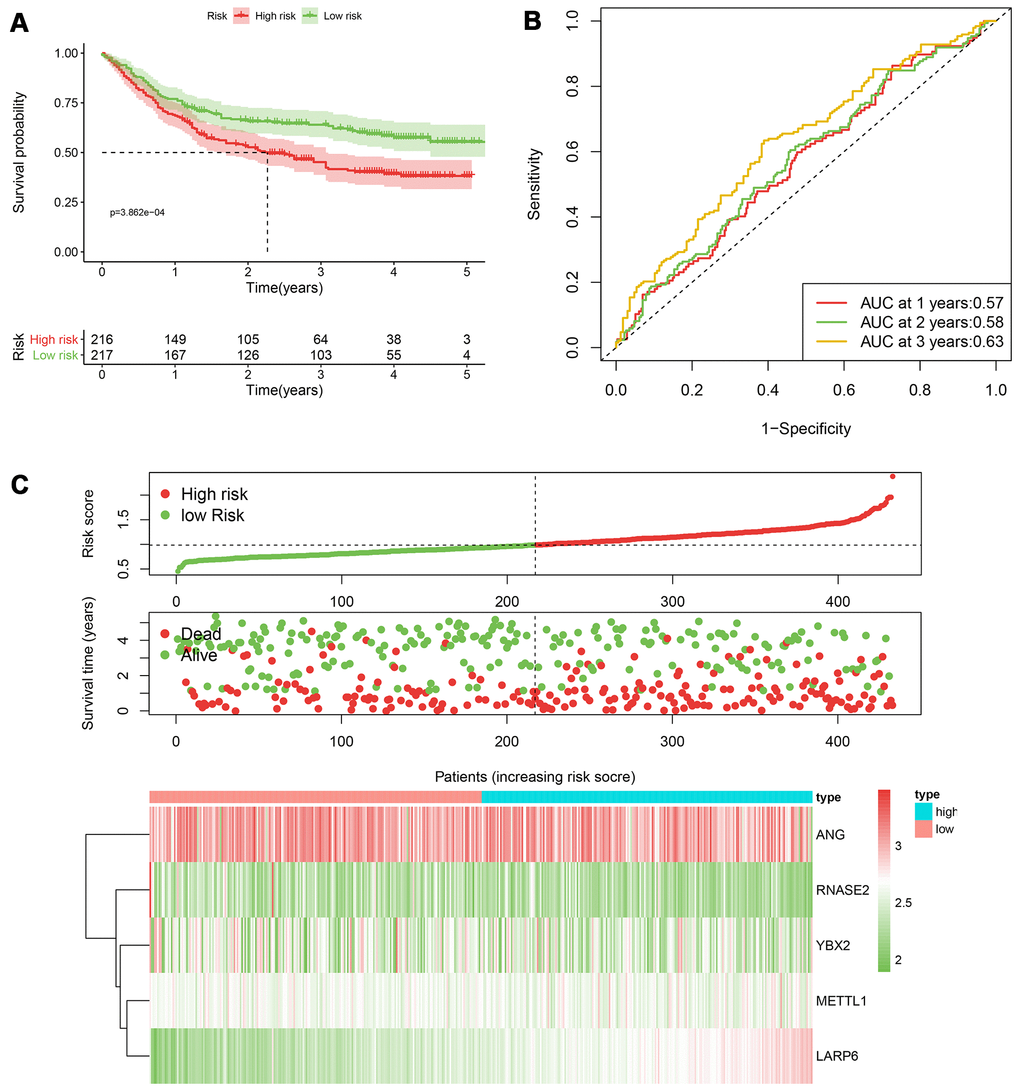
Figure 7.The performance of the 5-RBP risk model in the GEO dataset. (A) Survival curve for low- and high-risk groups; (B) Time-ROC curves of overall survival for validation; (C) Risk score distribution (upper), survival status (middle) and expression heatmap (bottom).