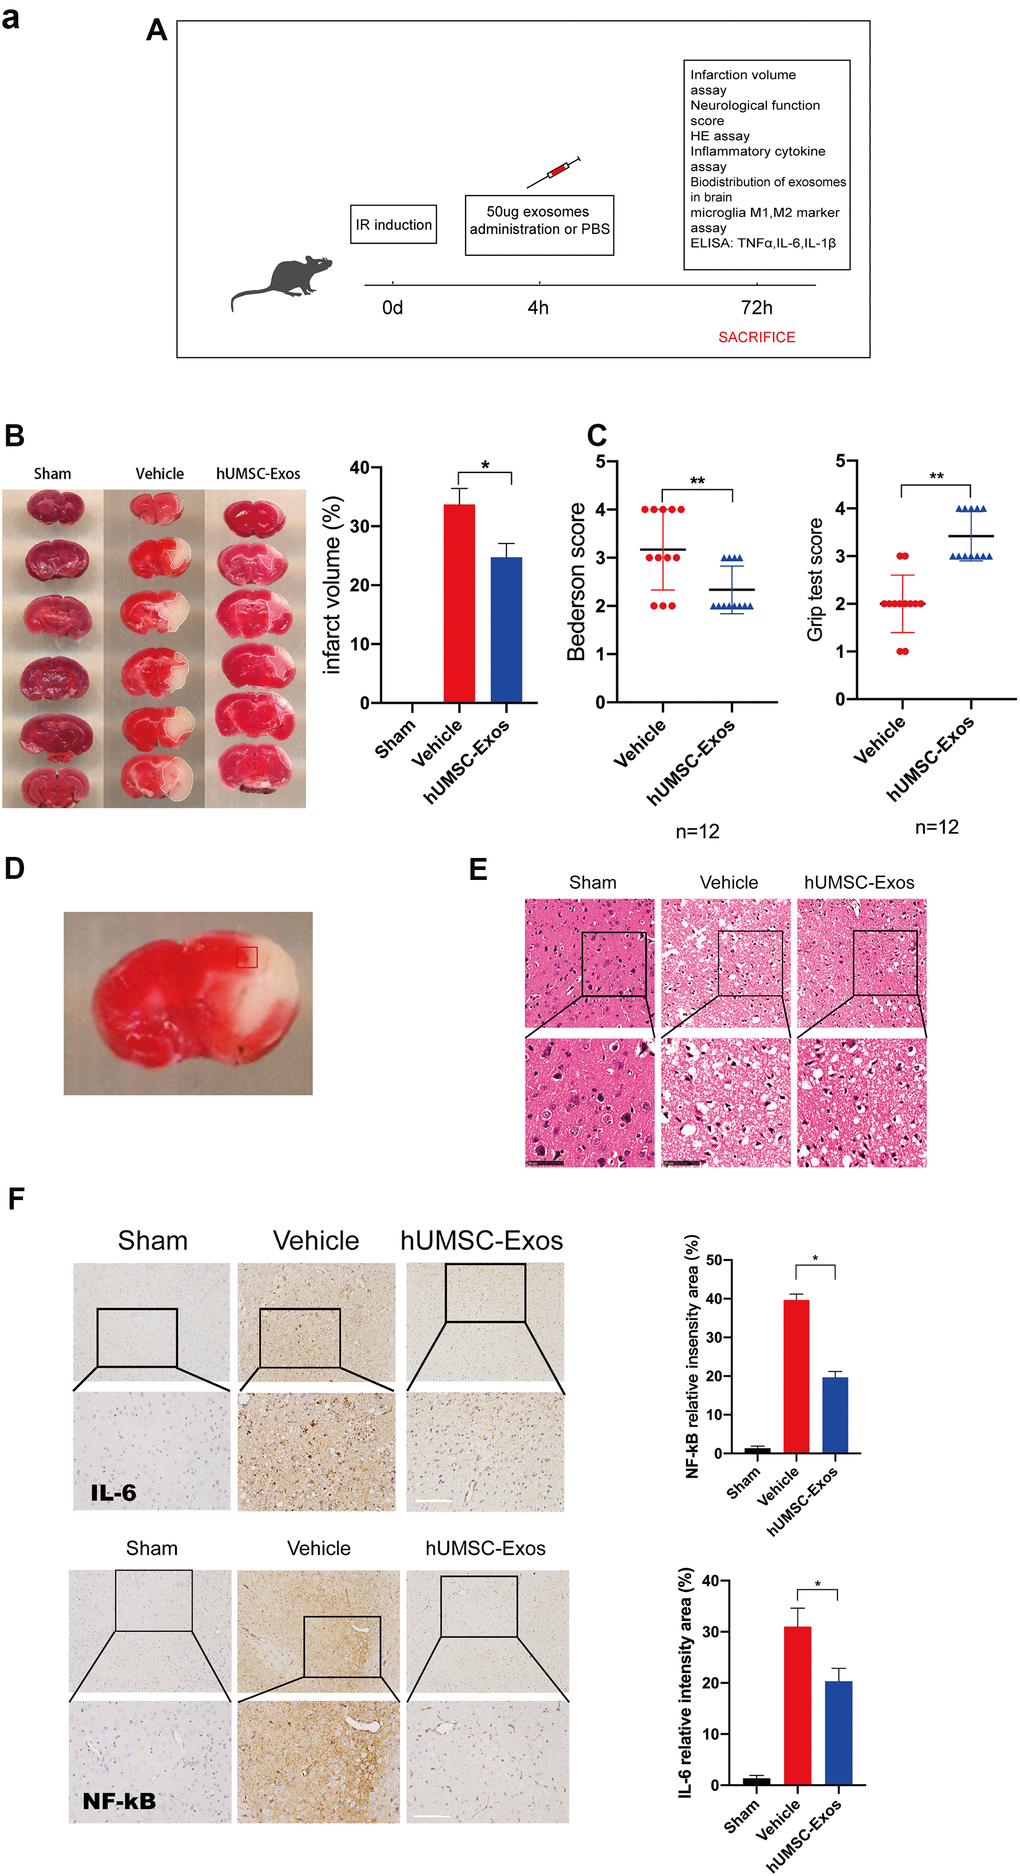
Figure 2.Treatment with hUMSC-Exos attenuates microglia-mediated inflammation and neurological deficits after ischemic stroke. (A) Schematic of the protocol. (B) Representative photomicrographs of TTC-stained tissue from the control, vehicle-only, and experimental groups, with associated infarct size as calculated using ImageJ software. Data are expressed as mean ± SEM (n = 12 per group). Significant differences are indicated (*p < 0.05). (C) Neurological deficit scores in the vehicle-only and experimental groups 72 hours post-reperfusion. Data are expressed as mean ± SEM (n = 12 per group). Significant differences are indicated (*p < 0.05, **p < 0.01). (D) The red box indicates the cerebral ischemic penumbra. (E) H&E staining. Scale bar: 50 μm. (F) Representative photomicrographs of IL-6 and NFκB in the ischemic penumbra 72 hours post-reperfusion, with associated relative intensities as calculated using ImageJ software. Scale bar: 50 μm. Data are expressed as mean ± SEM (n = 6 per group). Significant differences are indicated (*p < 0.05).
(G) Red fluorescence indicates PKH26-labeled exosomes which have accessed the site of cerebral damage. Scale bar: 50 μm. (H) Microglial M1 markers IBA-1 and CD16 in the ischemic penumbra 3 days following ischemic stroke, in the control, vehicle-only, and experimental groups. Scale bar: 50 μm. Associated M1 counts are shown (A, B). (I) Microglial M2 markers IBA-1 and CD206 in the ischemic penumbra 3 days following ischemic stroke, in the control, vehicle-only, and experimental groups. Scale bar: 50 μm. Associated M2 counts - from the same animals in which M1 counts were determined - are shown (C, D). Significant differences are indicated (*p < 0.05). (J) Lower protein levels of pro-inflammatory cytokines IL-6, TNF-α, and IL-1β in the experimental group. Data are expressed as mean ± SEM (experiments were performed in triplicate). Significant differences are indicated (*p < 0.05, **p < 0.01).