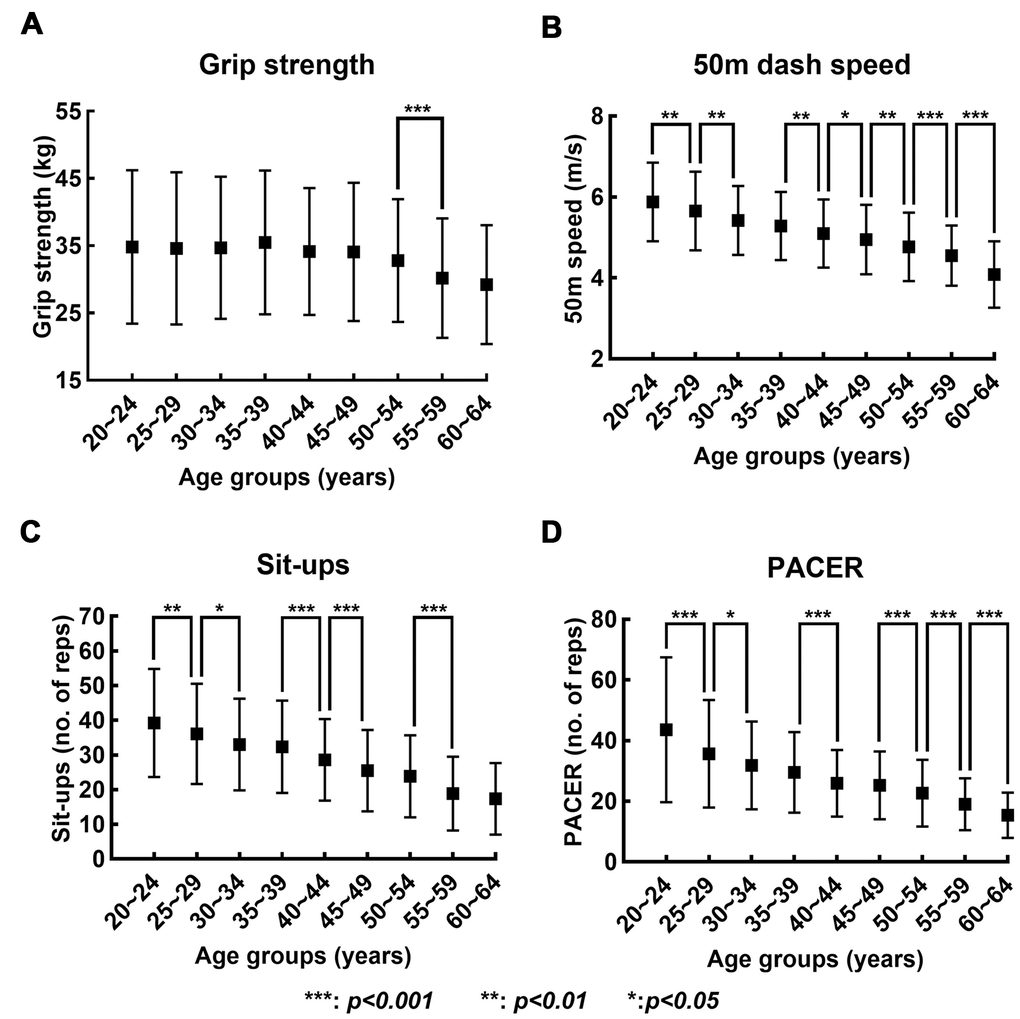
Figure 1.Changes in records in four fitness tests with increase in age. (A–D) show the mean (solid box) and standard deviation (bar) of the records in grip strength, 50-meters dash speed, sit-ups, and PACER, respectively, across the nine age groups.
Figure 1 — Analysis of the aging-induced changes in the motor ability structure using large population fitness test results | Aging