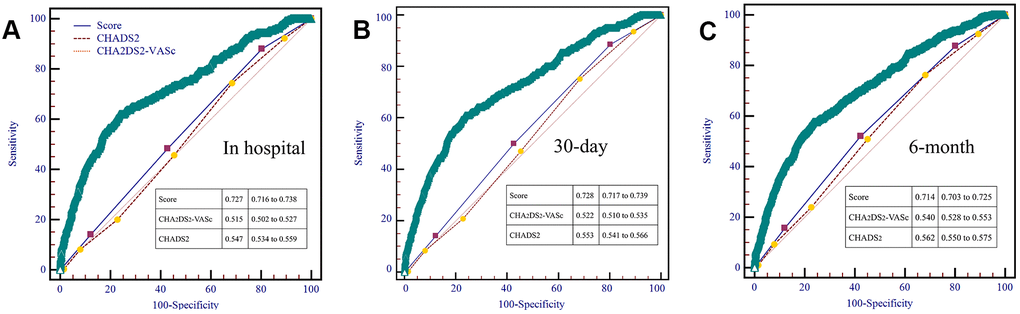
Figure 2.AUROC curves comparing prediction efficacy between our risk model and existing CHADS2 and CHA2DS2-VASc scores in hospital (A), 30-day (B) and 6-month (C) follow-up.
Figure 2 — A novel risk model to predict first-ever ischemic stroke in heart failure with reduced ejection fraction | Aging