Submit an Article
Navigate
Home
Editorial Board
Editorial Policies
Current Volume
Archive
Scientific Integrity
Publication Ethics Statements
Interviews with Outstanding Authors
Newsroom
Sponsored Conferences
Podcast
Contact
Special Collections
Submit an Article
Online ISSN: 1945-4589
Research Paper
|
Volume 13, Issue 4
|
pp. 5136–5149
Association between
PPAR-γ2
gene polymorphisms and diabetic retinopathy risk: a meta-analysis
Back to article
Figure 4
(4 of 5)
−
100%
+
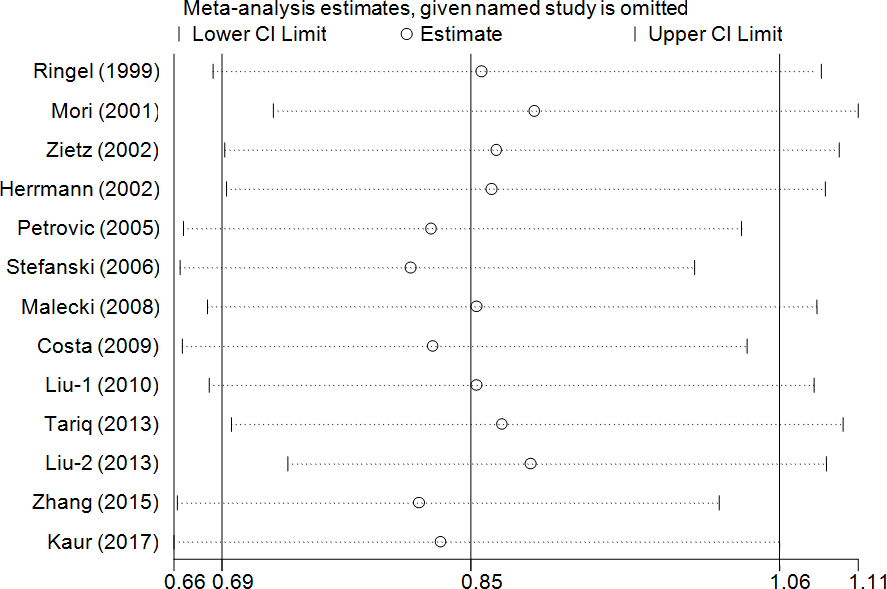
Figure 4.
Sensitivity analysis through deleting each study to reflect the influence of the individual dataset to the pooled ORs in CG+GG vs. CC model of
PPAR-γ2
rs1801282 C/G polymorphism.