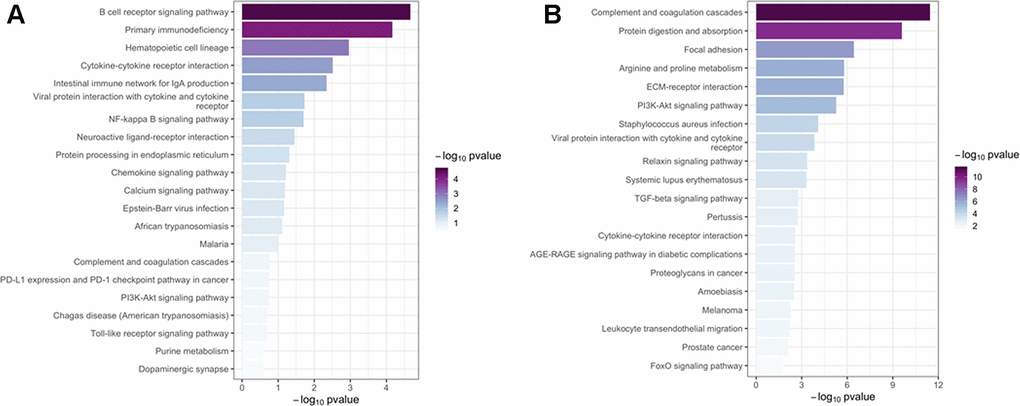
Figure 6.Kyoto Encyclopedia of Genes and Genomes pathway analysis. The top 20 significant (p < 0.05) KEGG signaling pathways were screened in the green-yellow (A) and brown (B) modules. Column color was used to map the p value of specific functional items: darker columns indicate smaller p values (greater significance) for the corresponding enrichment.