Submit an Article
Navigate
Home
Editorial Board
Editorial Policies
Current Volume
Archive
Scientific Integrity
Publication Ethics Statements
Interviews with Outstanding Authors
Newsroom
Sponsored Conferences
Podcast
Contact
Special Collections
Submit an Article
Online ISSN: 1945-4589
Research Paper
|
Volume 13, Issue 4
|
pp. 5120–5135
Identification of hub genes and key pathways in the emphysema phenotype of COPD
Back to article
Figure 4
(4 of 7)
−
100%
+
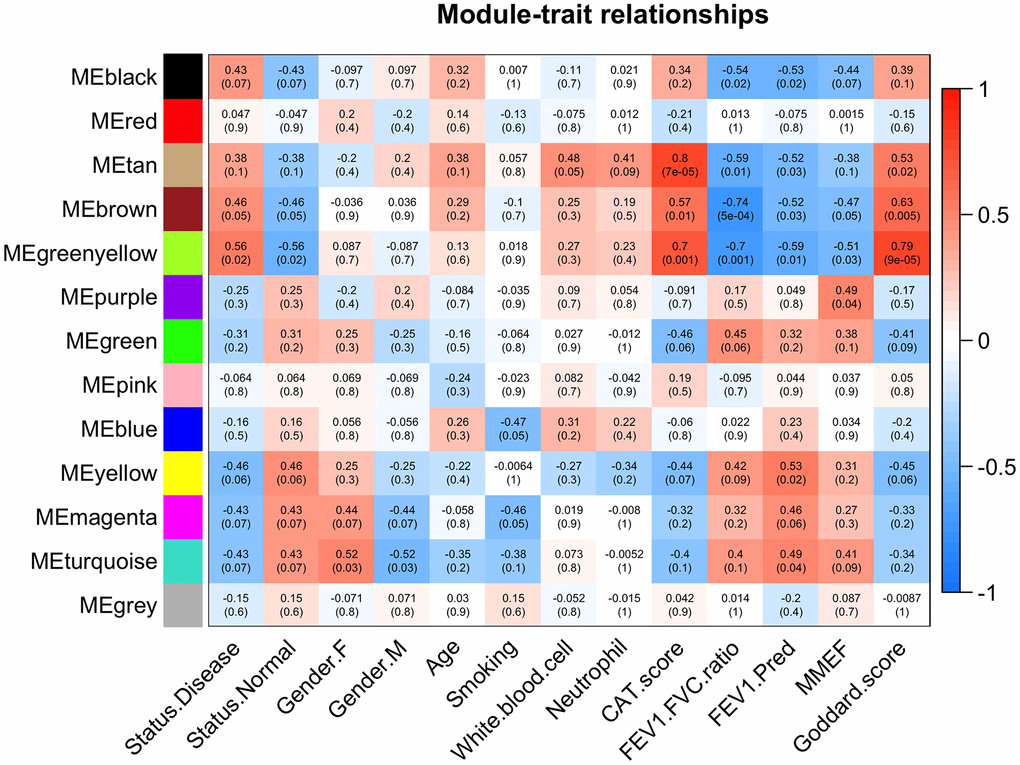
Figure 4.
Module-trait associations.
Each row corresponds to a module eigengene and each column to a trait. Each cell contains the corresponding correlation and p values. The table is color-coded based on correlation values.