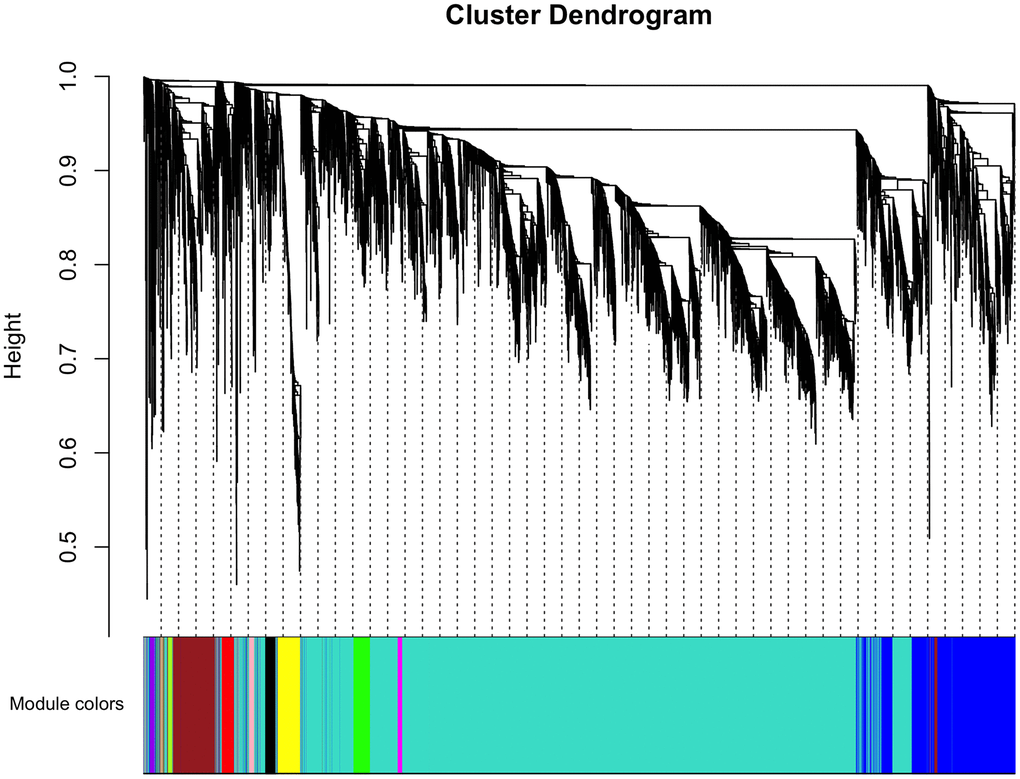
Figure 2.Cluster dendrogram of gene coexpression and functional modules. Heatmap plot of the topological overlap matrix (TOM) supplemented by hierarchical clustering dendrograms and module colors. A total of 13 distinct co-expression modules were identified containing tan to turquoise genes. Another 30 uncorrelated genes were assigned to a grey module that was not included in subsequent analyses.