Submit an Article
Navigate
Home
Editorial Board
Editorial Policies
Current Volume
Archive
Scientific Integrity
Publication Ethics Statements
Interviews with Outstanding Authors
Newsroom
Sponsored Conferences
Podcast
Contact
Special Collections
Submit an Article
Online ISSN: 1945-4589
Research Paper
|
Volume 13, Issue 4
|
pp. 5104–5119
Prognostic value of an autophagy-related long-noncoding-RNA signature for endometrial cancer
Back to article
Figure 4
(4 of 8)
−
100%
+
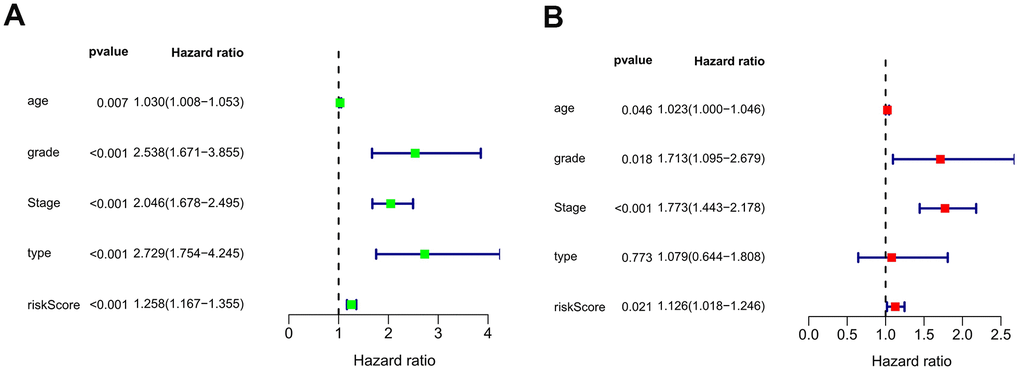
Figure 4.
The forest plots of univariate (
A
) and multivariate (
B
) Cox regression analysis of the prognostic value in the entire dataset.
Figure 4 — Prognostic value of an autophagy-related long-noncoding-RNA signature for endometrial cancer | Aging