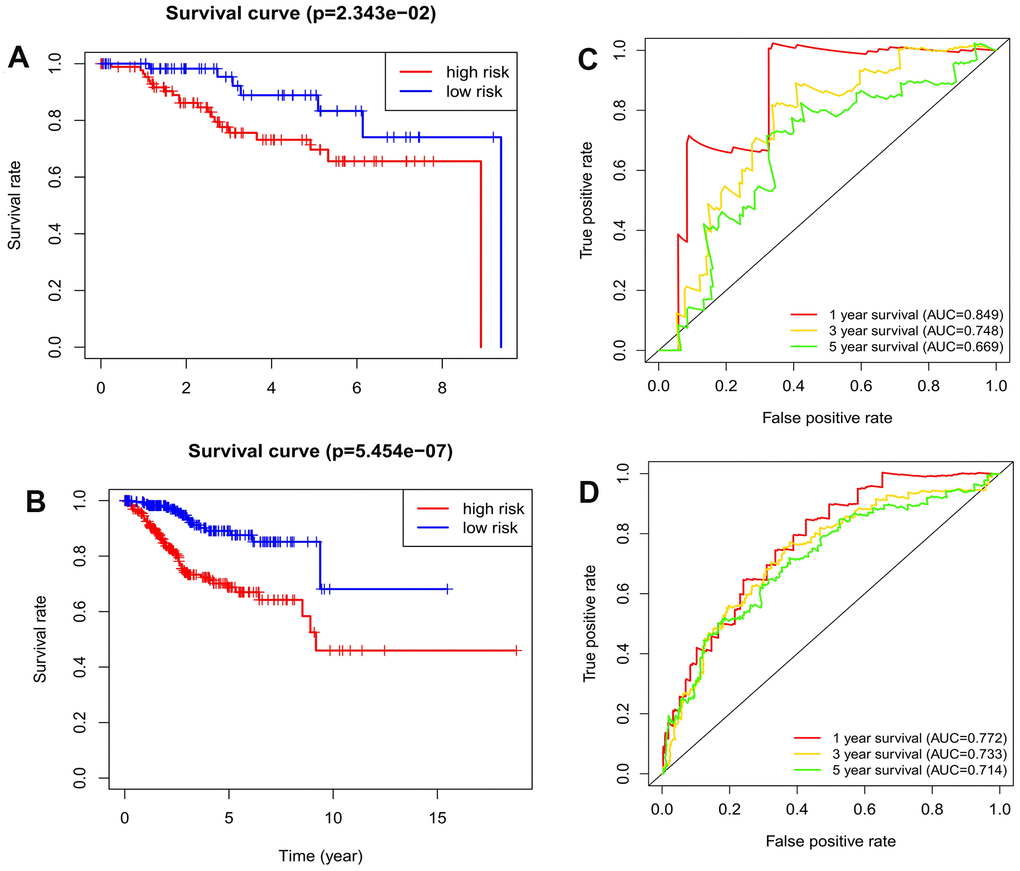
Figure 3.The validation of the autophagy-related lncRNA signature in the testing dataset and entire dataset. (A) Kaplan-Meier survival analysis for EC patients in the testing dataset; (B) Kaplan-Meier survival analysis for EC patients in the entire dataset; (C) Time-dependent ROC curve analysis for EC patients in the testing dataset. (D) Time-dependent ROC curve analysis for EC patients in the entire dataset.