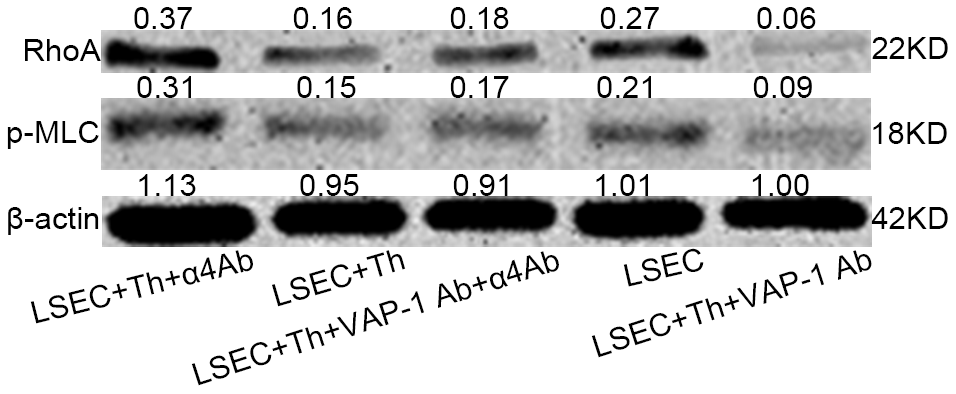
Figure 7.Western blot analysis of RhoA and p-MLC levels of isolated LSECs in each group in the co-cultivation systems. The level was higher in Lane 1 (anti-integrin α4 antibody group) than in lane 4 (pure isolated LSECs from fibrotic rats). And the level was lowest in lane 5 (anti-VAP-1 antibody group).