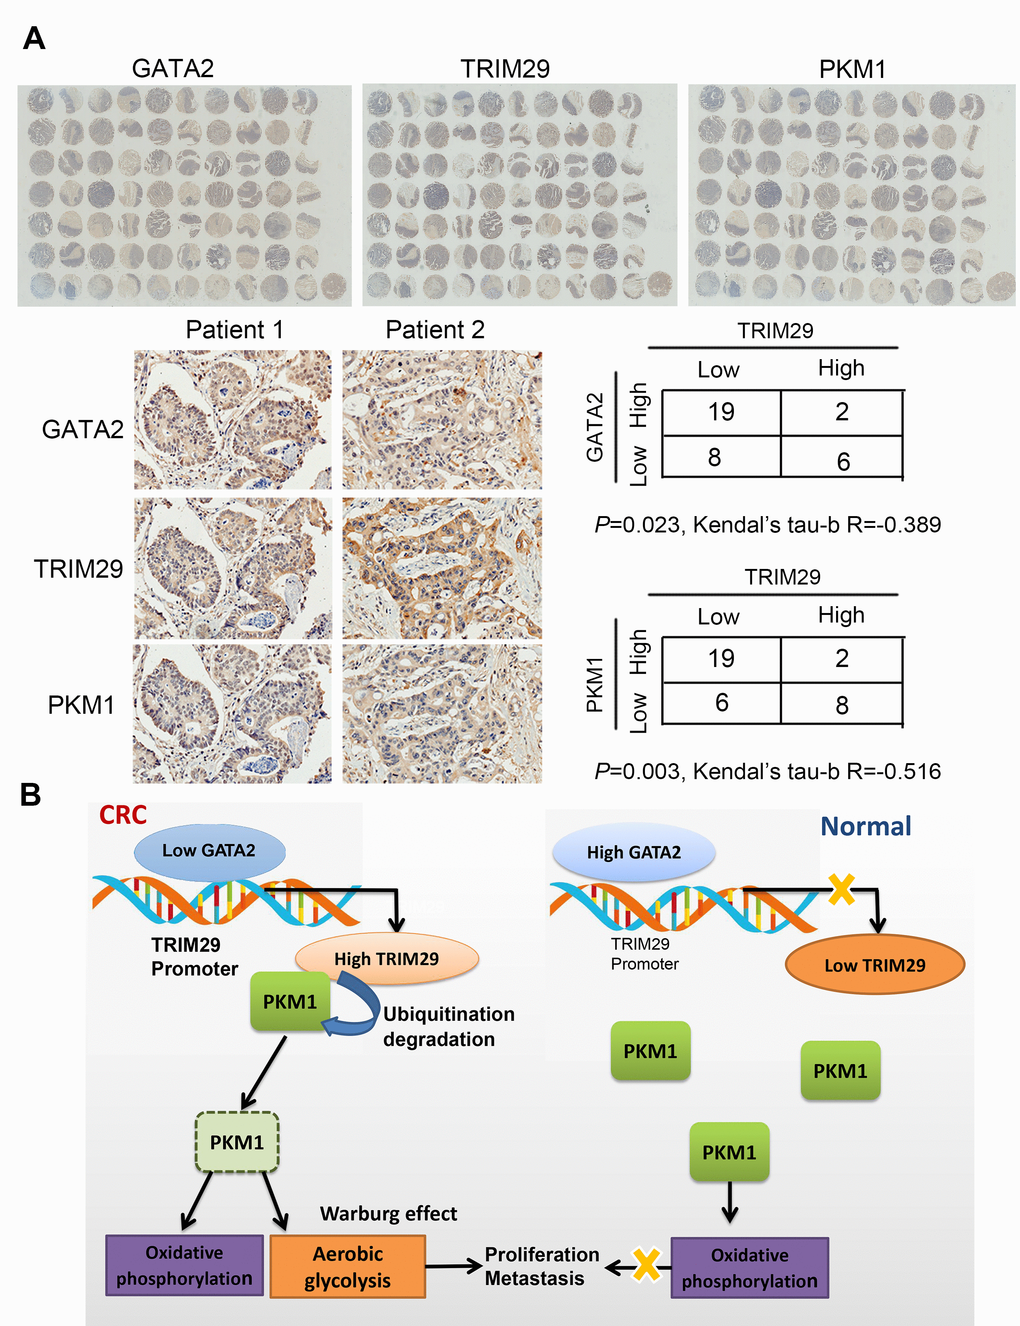
Figure 7.TRIM29 protein negatively correlates with GATA2 protein and PKM1 protein in CRC. (A) IHC results of TRIM29, GATA2 and PKM1 in the tissue array. (B) Model of the GATA2-TRIM29-PKM1 axis in CRC. The statistical analysis was performed using the Kendual’s tau-b test. *P < 0.05, **P < 0.01.