Submit an Article
Navigate
Home
Editorial Board
Editorial Policies
Current Volume
Archive
Scientific Integrity
Publication Ethics Statements
Interviews with Outstanding Authors
Newsroom
Sponsored Conferences
Podcast
Contact
Special Collections
Submit an Article
Online ISSN: 1945-4589
Research Paper
|
Volume 12, Issue 24
|
pp. 26221–26235
Construction and analysis of a joint diagnosis model of random forest and artificial neural network for heart failure
Back to article
Figure 5
(5 of 6)
−
100%
+
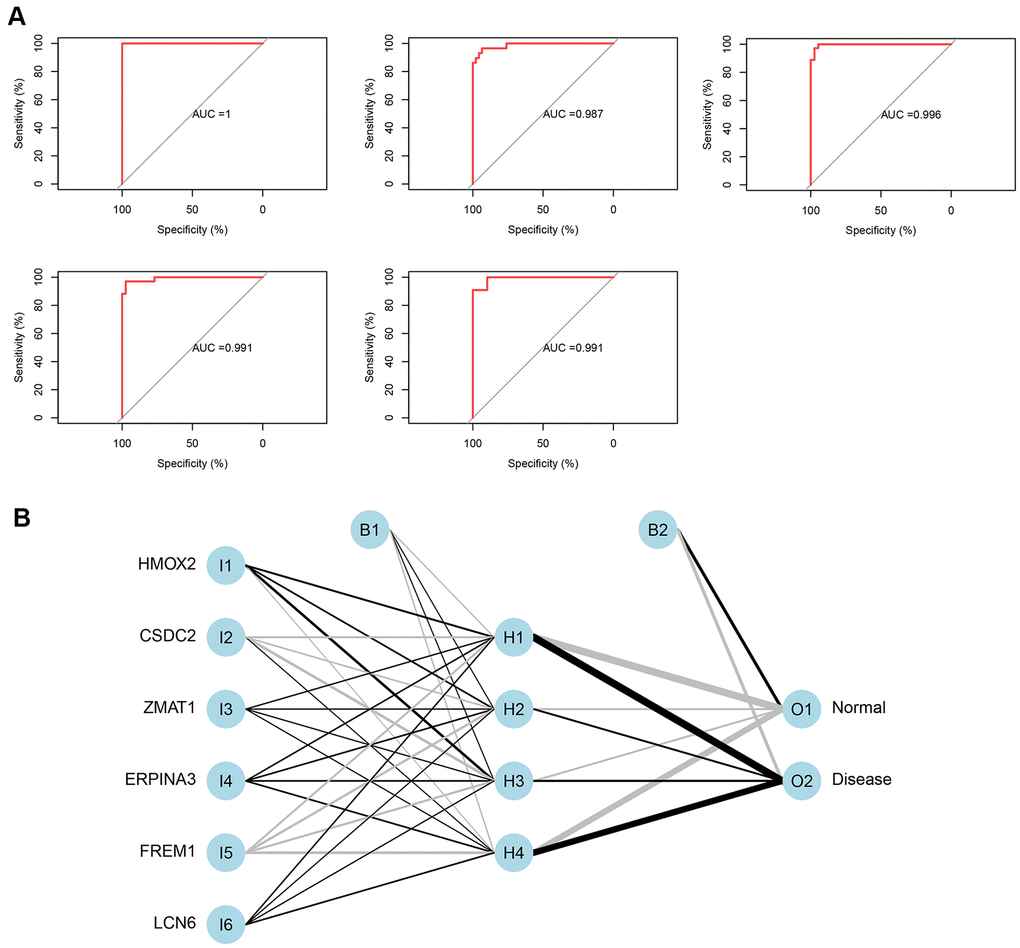
Figure 5.
(
A
) Verification of the ROC curve results by the five-time cross-validation model. (
B
) Results of neural network visualization.