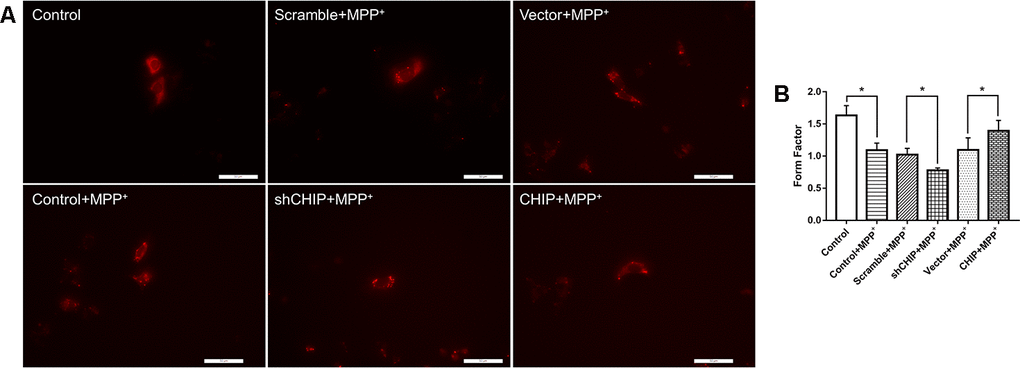
Figure 4.Mitochondrial morphology change of each group. (A) Mitochondria were labeled with MitoTracker Red. MPP+ treatment lead to fragmentation of mitochondria, while CHIP overexpression improved the mitochondria disruption. (B) Histogram of form factor analysis. *P<0.05.