Submit an Article
Navigate
Home
Editorial Board
Editorial Policies
Current Volume
Archive
Scientific Integrity
Publication Ethics Statements
Interviews with Outstanding Authors
Newsroom
Sponsored Conferences
Podcast
Contact
Special Collections
Submit an Article
Online ISSN: 1945-4589
Research Paper
|
Volume 12, Issue 24
|
pp. 24798–24816
Effects of choral singing versus health education on cognitive decline and aging: a randomized controlled trial
Back to article
Figure 1
(1 of 3)
−
100%
+
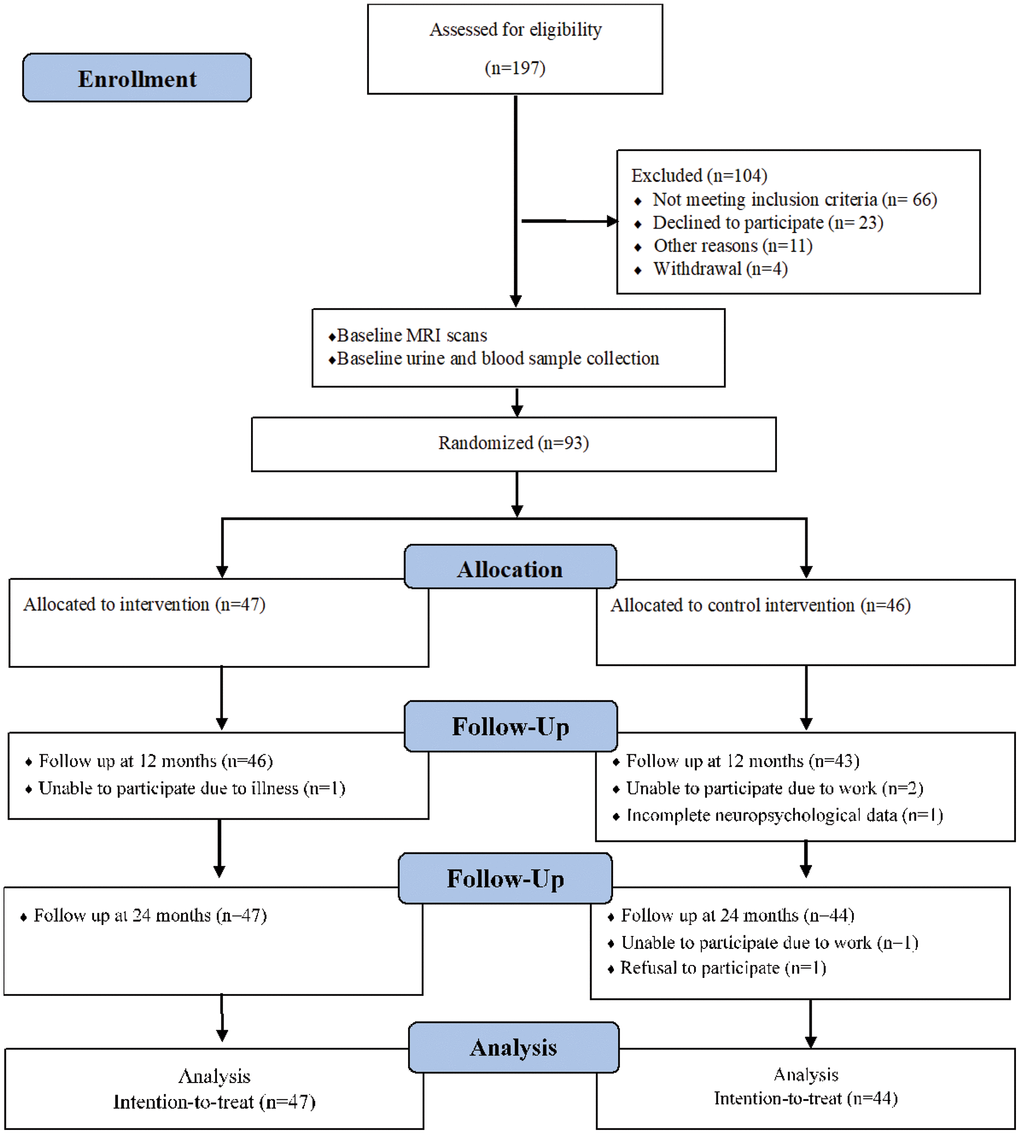
Figure 1.
Flow chart of participants through trial.
Figure 1 — Effects of choral singing versus health education on cognitive decline and aging: a randomized controlled trial | Aging