Submit an Article
Navigate
Home
Editorial Board
Editorial Policies
Current Volume
Archive
Scientific Integrity
Publication Ethics Statements
Interviews with Outstanding Authors
Newsroom
Sponsored Conferences
Podcast
Contact
Special Collections
Submit an Article
Online ISSN: 1945-4589
Research Paper
|
Volume 13, Issue 1
|
pp. 1383–1409
The therapeutic significance of the novel photodynamic material TPE-IQ-2O in tumors
Back to article
Figure 1
(1 of 8)
−
100%
+
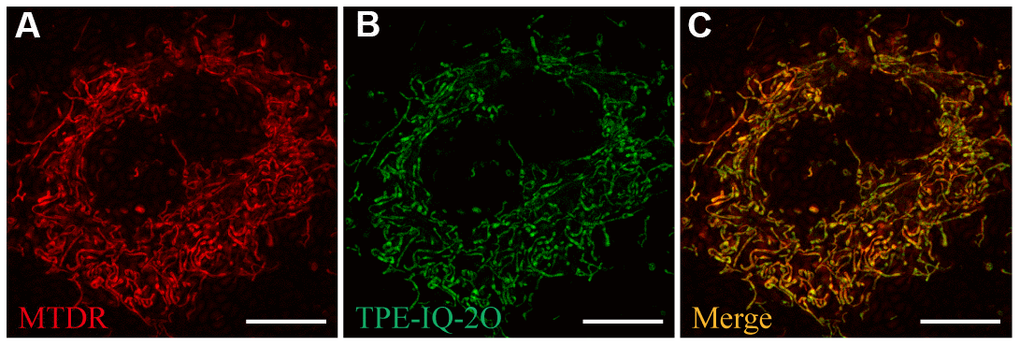
Figure 1.
Ultra-high-resolution fluorescence imaging of A549 cells.
(
A
) MTDR staining (50 nM). (
B
) TPE-IQ-2O (200 nM) staining. (
C
) Merged image of panels (
A
) and (
B
). λ
ex
: 650 nm (MTDR) and 488 nm (TPE-IQ-2O); scale bar =10 μm.