Submit an Article
Navigate
Home
Editorial Board
Editorial Policies
Current Volume
Archive
Scientific Integrity
Publication Ethics Statements
Interviews with Outstanding Authors
Newsroom
Sponsored Conferences
Podcast
Contact
Special Collections
Submit an Article
Online ISSN: 1945-4589
Research Paper
|
Volume 12, Issue 24
|
pp. 24721–24733
Age and gender related differences in load-strain response in C57Bl/6 mice
Back to article
Figure 3
(3 of 8)
−
100%
+
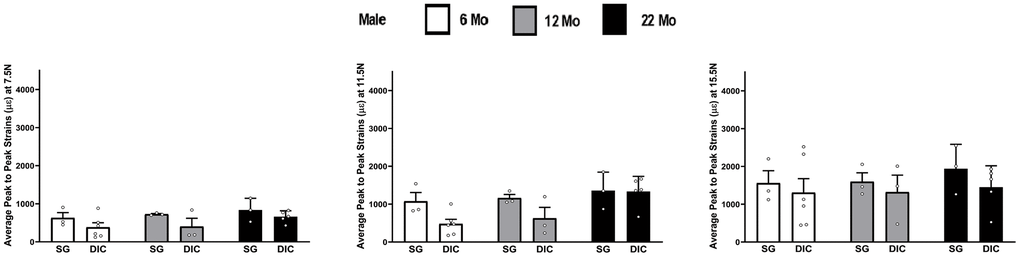
Figure 3.
Strains captured by Digital Image Correlation (DIC) and Strain Gage in male tibiae at load levels of 7.5 N, 11.5 N and 15.5 N.