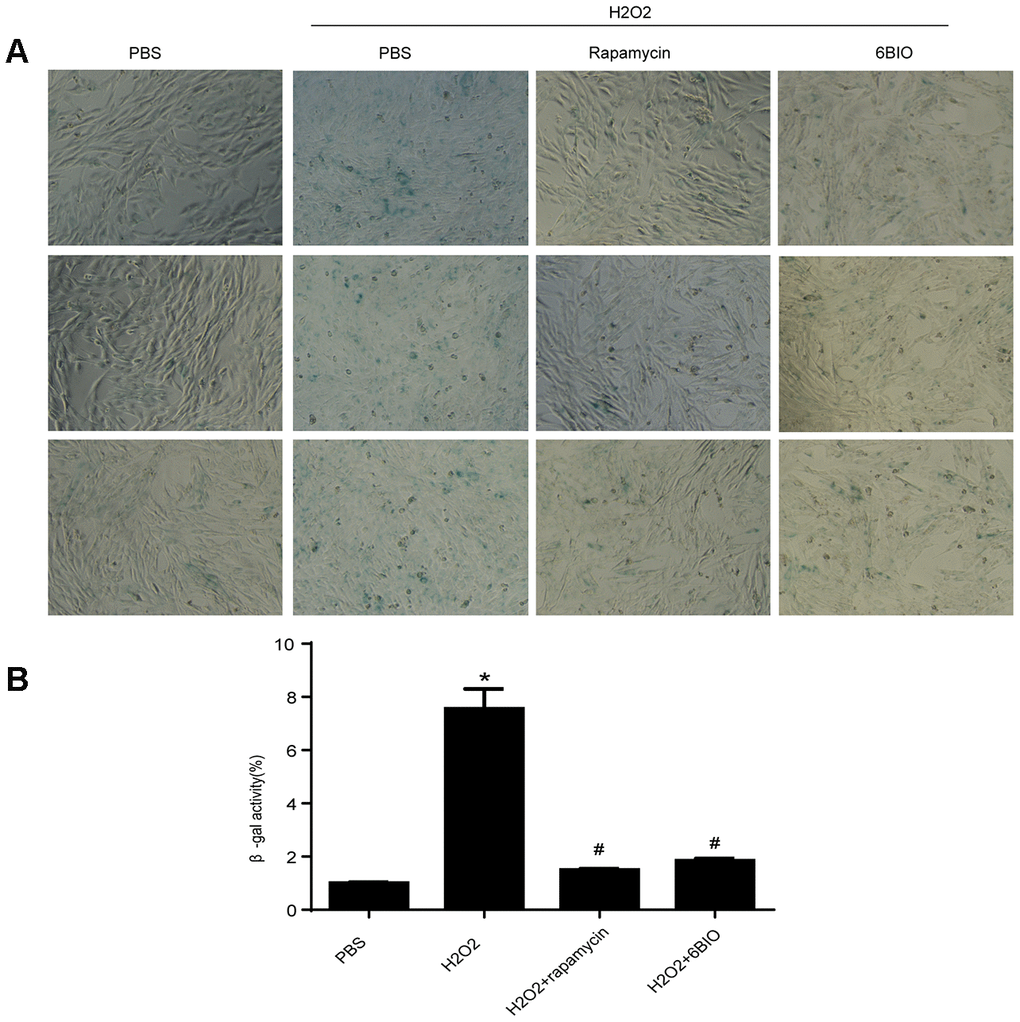
Figure 5.(A) Representative pictures of senescence-associated β -gal staining (×200) and (B) evaluation of senescence-associated β -gal activity assay. *P<0.05 compared with the control group treated with PBS; #P<0.05 compared with the H2O2-induced aging group.