Submit an Article
Navigate
Home
Editorial Board
Editorial Policies
Current Volume
Archive
Scientific Integrity
Publication Ethics Statements
Interviews with Outstanding Authors
Newsroom
Sponsored Conferences
Podcast
Contact
Special Collections
Submit an Article
Online ISSN: 1945-4589
Research Paper
|
Volume 12, Issue 24
|
pp. 26047–26062
6-Bromoindirubin-3’-oxime (6BIO) prevents myocardium from aging by inducing autophagy
Back to article
Figure 1
(1 of 10)
−
100%
+
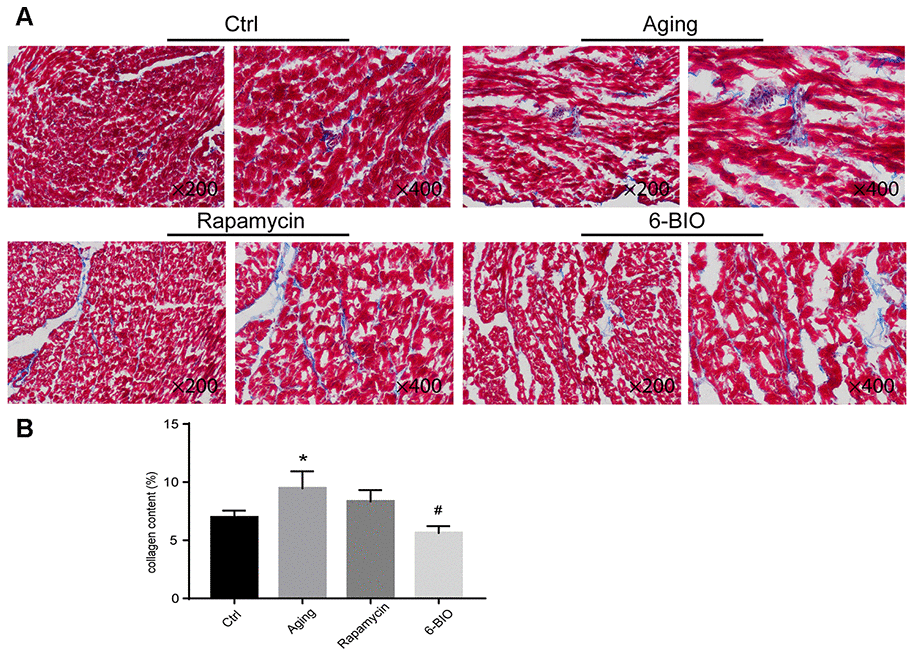
Figure 1.
(
A
,
B
) Representative photomicrographs of Masson-stained myocardium (×200 and ×400). *P<0.05 compared with the young control group; #P<0.05 compared with the aging group.