Submit an Article
Navigate
Home
Editorial Board
Editorial Policies
Current Volume
Archive
Scientific Integrity
Publication Ethics Statements
Interviews with Outstanding Authors
Newsroom
Sponsored Conferences
Podcast
Contact
Special Collections
Submit an Article
Online ISSN: 1945-4589
Review
|
Volume 13, Issue 1
|
pp. 1498–1509
Safety and efficacy of convalescent plasma therapy in severely and critically ill patients with COVID-19: a systematic review with meta-analysis
Back to article
Figure 5
(5 of 5)
−
100%
+
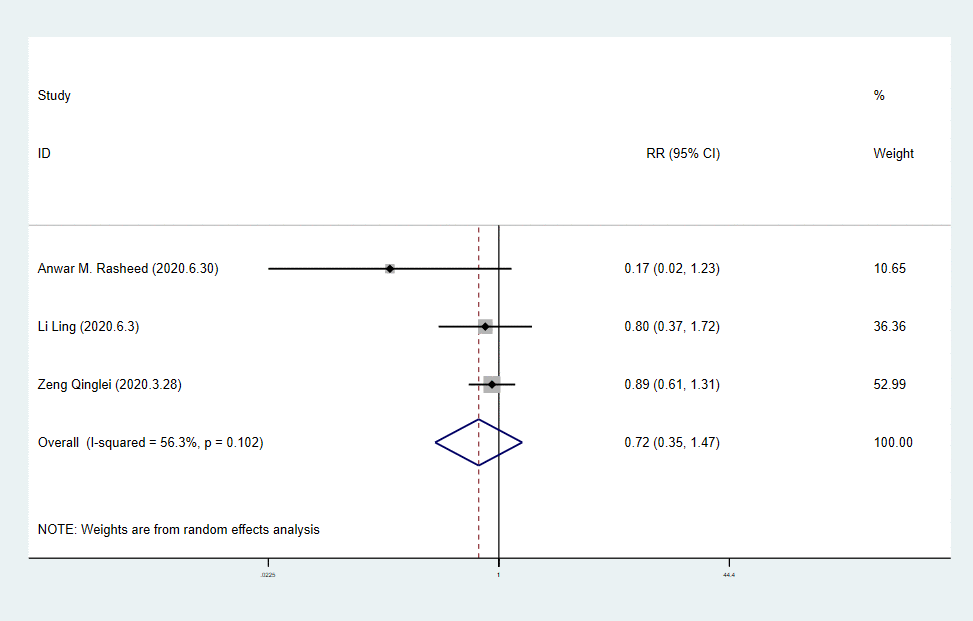
Figure 5.
Forest plot of RR for mortality in critical patients with COVID-19.